Delta Volume Columns Pro [LucF]█ OVERVIEW
This indicator displays volume delta information calculated with intrabar inspection on historical bars, and feed updates when running in realtime. It is designed to run in a pane and can display either stacked buy/sell volume columns or a signal line which can be calculated and displayed in many different ways.
Five different models are offered to reveal different characteristics of the calculated volume delta information. Many options are offered to visualize the calculations, giving you much leeway in morphing the indicator's visuals to suit your needs. If you value delta volume information, I hope you will find the time required to master Delta Volume Columns Pro well worth the investment. I am confident that if you combine a proper understanding of the indicator's information with an intimate knowledge of the volume idiosyncrasies on the markets you trade, you can extract useful market intelligence using this tool.
█ WARNINGS
1. The indicator only works on markets where volume information is available,
Please validate that your symbol's feed carries volume information before asking me why the indicator doesn't plot values.
2. When you refresh your chart or re-execute the script on the chart, the indicator will repaint because elapsed realtime bars will then recalculate as historical bars.
3. Because the indicator uses different modes of calculation on historical and realtime bars, it's critical that you understand the differences between them. Details are provided further down.
4. Calculations using intrabar inspection on historical bars can only be done from some chart timeframes. See further down for a list of supported timeframes.
If the chart's timeframe is not supported, no historical volume delta will display.
█ CONCEPTS
Chart bars
Three different types of bars are used in charts:
1. Historical bars are bars that have already closed when the script executes on them.
2. The realtime bar is the current, incomplete bar where a script is running on an open market. There is only one active realtime bar on your chart at any given time.
The realtime bar is where alerts trigger.
3. Elapsed realtime bars are bars that were calculated when they were realtime bars but have since closed.
When a script re-executes on a chart because the browser tab is refreshed or some of its inputs are changed, elapsed realtime bars are recalculated as historical bars.
Why does this indicator use two modes of calculation?
Historical bars on TradingView charts contain OHLCV data only, which is insufficient to calculate volume delta on them with any level of precision. To mine more detailed information from those bars we look at intrabars , i.e., bars from a smaller timeframe (we call it the intrabar timeframe ) that are contained in one chart bar. If your chart Is running at 1D on a 24x7 market for example, most 1D chart bars will contain 24 underlying 1H bars in their dilation. On historical bars, this indicator looks at those intrabars to amass volume delta information. If the intrabar is up, its volume goes in the Buy bin, and inversely for the Sell bin. When price does not move on an intrabar, the polarity of the last known movement is used to determine in which bin its volume goes.
In realtime, we have access to price and volume change for each update of the chart. Because a 1D chart bar can be updated tens of thousands of times during the day, volume delta calculations on those updates is much more precise. This precision, however, comes at a price:
— The script must be running on the chart for it to keep calculating in realtime.
— If you refresh your chart you will lose all accumulated realtime calculations on elapsed realtime bars, and the realtime bar.
Elapsed realtime bars will recalculate as historical bars, i.e., using intrabar inspection, and the realtime bar's calculations will reset.
When the script recalculates elapsed realtime bars as historical bars, the values on those bars will change, which means the script repaints in those conditions.
— When the indicator first calculates on a chart containing an incomplete realtime bar, it will count ALL the existing volume on the bar as Buy or Sell volume,
depending on the polarity of the bar at that point. This will skew calculations for that first bar. Scripts have no access to the history of a realtime bar's previous updates,
and intrabar inspection cannot be used on realtime bars, so this is the only to go about this.
— Even if alerts only trigger upon confirmation of their conditions after the realtime bar closes, they are repainting alerts
because they would perhaps not have calculated the same way using intrabar inspection.
— On markets like stocks that often have different EOD and intraday feeds and volume information,
the volume's scale may not be the same for the realtime bar if your chart is at 1D, for example,
and the indicator is using an intraday timeframe to calculate on historical bars.
— Any chart timeframe can be used in realtime mode, but plots that include moving averages in their calculations may require many elapsed realtime bars before they can calculate.
You might prefer drastically reducing the periods of the moving averages, or using the volume columns mode, which displays instant values, instead of the line.
Volume Delta Balances
This indicator uses a variety of methods to evaluate five volume delta balances and derive other values from those balances. The five balances are:
1 — On Bar Balance : This is the only balance using instant values; it is simply the subtraction of the Sell volume from the Buy volume on the bar.
2 — Average Balance : Calculates a distinct EMA for both the Buy and Sell volumes, and subtracts the Sell EMA from the Buy EMA.
3 — Momentum Balance : Starts by calculating, separately for both Buy and Sell volumes, the difference between the same EMAs used in "Average Balance" and
an SMA of double the period used for the "Average Balance" EMAs. The difference for the Sell side is subtracted from the difference for the Buy side,
and an RSI of that value is calculated and brought over the −50/+50 scale.
4 — Relative Balance : The reference values used in the calculation are the Buy and Sell EMAs used in the "Average Balance".
From those, we calculate two intermediate values using how much the instant Buy and Sell volumes on the bar exceed their respective EMA — but with a twist.
If the bar's Buy volume does not exceed the EMA of Buy volume, a zero value is used. The same goes for the Sell volume with the EMA of Sell volume.
Once we have our two intermediate values for the Buy and Sell volumes exceeding their respective MA, we subtract them. The final "Relative Balance" value is an ALMA of that subtraction.
The rationale behind using zero values when the bar's Buy/Sell volume does not exceed its EMA is to only take into account the more significant volume.
If both instant volume values exceed their MA, then the difference between the two is the signal's value.
The signal is called "relative" because the intermediate values are the difference between the instant Buy/Sell volumes and their respective MA.
This balance flatlines when the bar's Buy/Sell volumes do not exceed their EMAs, which makes it useful to spot areas where trader interest dwindles, such as consolidations.
The smaller the period of the final value's ALMA, the more easily you will see the balance flatline. These flat zones should be considered no-trade zones.
5 — Percent Balance : This balance is the ALMA of the ratio of the "On Bar Balance" value, i.e., the volume delta balance on the bar (which can be positive or negative),
over the total volume for that bar.
From the balances and marker conditions, two more values are calculated:
1 — Marker Bias : It sums the up/down (+1/‒1) occurrences of the markers 1 to 4 over a period you define, so it ranges from −4 to +4, times the period.
Its calculation will depend on the modes used to calculate markers 3 and 4.
2 — Combined Balances : This is the sum of the bull/bear (+1/−1) states of each of the five balances, so it ranges from −5 to +5.
█ FEATURES
The indicator has two main modes of operation: Columns and Line .
Columns
• In Columns mode you can display stacked Buy/Sell volume columns.
• The buy section always appears above the centerline, the sell section below.
• The top and bottom sections can be colored independently using eight different methods.
• The EMAs of the Buy/Sell values can be displayed (these are the same EMAs used to calculate the "Average Balance").
Line
• Displays one of seven signals: the five balances or one of two complementary values, i.e., the "Marker Bias" or the "Combined Balances".
• You can color the line and its fill using independent calculation modes to pack more information in the display.
You can thus appraise the state of 3 different values using the line itself, its color and the color of its fill.
• A "Divergence Levels" feature will use the line to automatically draw expanding levels on divergence events.
Default settings
Using the indicator's default settings, this is the information displayed:
• The line is calculated on the "Average Balance".
• The line's color is determined by the bull/bear state of the "Percent Balance".
• The line's fill gradient is determined by the advances/declines of the "Momentum Balance".
• The orange divergence dots are calculated using discrepancies between the polarity of the "On Bar Balance" and the chart's bar.
• The divergence levels are determined using the line's level when a divergence occurs.
• The background's fill gradient is calculated on advances/declines of the "Marker Bias".
• The chart bars are colored using advances/declines of the "Relative Balance". Divergences are shown in orange.
• The intrabar timeframe is automatically determined from the chart's timeframe so that a minimum of 50 intrabars are used to calculate volume delta on historical bars.
Alerts
The configuration of the marker conditions explained further is what determines the conditions that will trigger alerts created from this script. Note that simply selecting the display of markers does not create alerts. To create an alert on this script, you must use ALT-A from the chart. You can create multiple alerts triggering on different conditions from this same script; simply configure the markers so they define the trigger conditions for each alert before creating the alert. The configuration of the script's inputs is saved with the alert, so from then on you can change them without affecting the alert. Alert messages will mention the marker(s) that triggered the specific alert event. Keep in mind, when creating alerts on small chart timeframes, that discrepancies between alert triggers and markers displayed on your chart are to be expected. This is because the alert and your chart are running two distinct instances of the indicator on different servers and different feeds. Also keep in mind that while alerts only trigger on confirmed conditions, they are calculated using realtime calculation mode, which entails that if you refresh your chart and elapsed realtime bars recalculate as historical bars using intrabar inspection, markers will not appear in the same places they appeared in realtime. So it's important to understand that even though the alert conditions are confirmed when they trigger, these alerts will repaint.
Let's go through the sections of the script's inputs.
Columns
The size of the Buy/Sell columns always represents their respective importance on the bar, but the coloring mode for tops and bottoms is independent. The default setup uses a standard coloring mode where the Buy/Sell columns are always in the bull/bear color with a higher intensity for the winning side. Seven other coloring modes allow you to pack more information in the columns. When choosing to color the top columns using a bull/bear gradient on "Average Balance", for example, you will have bull/bear colored tops. In order for the color of the bottom columns to continue to show the instant bar balance, you can then choose the "On Bar Balance — Dual Solid Colors" coloring mode to make those bars the color of the winning side for that bar. You can display the averages of the Buy and Sell columns. If you do, its coloring is controlled through the "Line" and "Line fill" sections below.
Line and Line fill
You can select the calculation mode and the thickness of the line, and independent calculations to determine the line's color and fill.
Zero Line
The zero line can display dots when all five balances are bull/bear.
Divergences
You first select the detection mode. Divergences occur whenever the up/down direction of the signal does not match the up/down polarity of the bar. Divergences are used in three components of the indicator's visuals: the orange dot, colored chart bars, and to calculate the divergence levels on the line. The divergence levels are dynamic levels that automatically build from the line's values on divergence events. On consecutive divergences, the levels will expand, creating a channel. This implementation of the divergence levels corresponds to my view that divergences indicate anomalies, hesitations, points of uncertainty if you will. It precludes any attempt to identify a directional bias to divergences. Accordingly, the levels merely take note of divergence events and mark those points in time with levels. Traders then have a reference point from which they can evaluate further movement. The bull/bear/neutral colors used to plot the levels are also congruent with this view in that they are determined by the line's position relative to the levels, which is how I think divergences can be put to the most effective use. One of the coloring modes for the line's fill uses advances/declines in the line after divergence events.
Background
The background can show a bull/bear gradient on six different calculations. As with other gradients, you can adjust its brightness to make its importance proportional to how you use it in your analysis.
Chart bars
Chart bars can be colored using seven different methods. You have the option of emptying the body of bars where volume does not increase, as does my TLD indicator, and you can choose whether you want to show divergences.
Intrabar Timeframe
This is the intrabar timeframe that will be used to calculate volume delta using intrabar inspection on historical bars. You can choose between four modes. The three "Auto-steps" modes calculate, from the chart's timeframe, the intrabar timeframe where the said number of intrabars will make up the dilation of chart bars. Adjustments are made for non-24x7 markets. "Fixed" mode allows you to select the intrabar timeframe you want. Checking the "Show TF" box will display in the lower-right corner the intrabar timeframe used at any given moment. The proper selection of the intrabar timeframe is important. It must achieve maximal granularity to produce precise results while not unduly slowing down calculations, or worse, causing runtime errors. Note that historical depth will vary with the intrabar timeframe. The smaller the timeframe, the shallower historical plots you will be.
Markers
Markers appear when the required condition has been confirmed on a closed bar. The configuration of the markers when you create an alert is what determines when the alert will trigger. Five markers are available:
• Balances Agreement : All five balances are either bullish or bearish.
• Double Bumps : A double bump is two consecutive up/down bars with +/‒ volume delta, and rising Buy/Sell volume above its average.
• Divergence confirmations : A divergence is confirmed up/down when the chosen balance is up/down on the previous bar when that bar was down/up, and this bar is up/down.
• Balance Shifts : These are bull/bear transitions of the selected signal.
• Marker Bias Shifts : Marker bias shifts occur when it crosses into bull/bear territory.
Periods
Allows control over the periods of the different moving averages used to calculate the balances.
Volume Discrepancies
Stock exchanges do not report the same volume for intraday and daily (or higher) resolutions. Other variations in how volume information is reported can also occur in other markets, namely Forex, where volume irregularities can even occur between different intraday timeframes. This will cause discrepancies between the total volume on the bar at the chart's timeframe, and the total volume calculated by adding the volume of the intrabars in that bar's dilation. This does not necessarily invalidate the volume delta information calculated from intrabars, but it tells us that we are using partial volume data. A mechanism to detect chart vs intrabar timeframe volume discrepancies is provided. It allows you to define a threshold percentage above which the background will indicate a difference has been detected.
Other Settings
You can control here the display of the gray dot reminder on realtime bars, and the display of error messages if you are using a chart timeframe that is not greater than the fixed intrabar timeframe, when you use that mode. Disabling the message can be useful if you only use realtime mode at chart timeframes that do not support intrabar inspection.
█ RAMBLINGS
On Volume Delta
Volume is arguably the best complement to interpret price action, and I consider volume delta to be the most effective way of processing volume information. In periods of low-volatility price consolidations, volume will typically also be lower than normal, but slight imbalances in the trend of the buy/sell volume balance can sometimes help put early odds on the direction of the break from consolidation. Additionally, the progression of the volume imbalance can help determine the proximity of the breakout. I also find volume delta and the number of divergences very useful to evaluate the strength of trends. In trends, I am looking for "slow and steady", i.e., relatively low volatility and pauses where price action doesn't look like world affairs are being reassessed. In my personal mythology, this type of trend is often more resilient than high-volatility breakouts, especially when volume balance confirms the general agreement of traders signaled by the low-volatility usually accompanying this type of trend. The volume action on pauses will often help me decide between aggressively taking profits, tightening a stop or going for a longer-term movement. As for reversals, they generally occur in high-volatility areas where entering trades is more expensive and riskier. While the identification of counter-trend reversals fascinates many traders to no end, they represent poor opportunities in my view. Volume imbalances often precede reversals, but I prefer to use volume delta information to identify the areas following reversals where I can confirm them and make relatively low-cost entries with better odds.
On "Buy/Sell" Volume
Buying or selling volume are misnomers, as every unit of volume transacted is both bought and sold by two different traders. While this does not keep me from using the terms, there is no such thing as “buy only” or “sell only” volume. Trader lingo is riddled with peculiarities.
Divergences
The divergence detection method used here relies on a difference between the direction of a signal and the polarity (up/down) of a chart bar. When using the default "On Bar Balance" to detect divergences, however, only the bar's volume delta is used. You may wonder how there can be divergences between buying/selling volume information and price movement on one bar. This will sometimes be due to the calculation's shortcomings, but divergences may also occur in instances where because of order book structure, it takes less volume to increase the price of an asset than it takes to decrease it. As usual, divergences are points of interest because they reveal imbalances, which may or may not become turning points. To your pattern-hungry brain, the divergences displayed by this indicator will — as they do on other indicators — appear to often indicate turnarounds. My opinion is that reality is generally quite sobering and I have no reliable information that would tend to prove otherwise. Exercise caution when using them. Consequently, I do not share the overwhelming enthusiasm of traders in identifying bullish/bearish divergences. For me, the best course of action when a divergence occurs is to wait and see what happens from there. That is the rationale underlying how my divergence levels work; they take note of a signal's level when a divergence occurs, and it's the signal's behavior from that point on that determines if the post-divergence action is bullish/bearish.
Superfluity
In "The Bed of Procrustes", Nassim Nicholas Taleb writes: To bankrupt a fool, give him information . This indicator can display lots of information. While learning to use a new indicator inevitably requires an adaptation period where we put it through its paces and try out all its options, once you have become used to it and decide to adopt it, rigorously eliminate the components you don't use and configure the remaining ones so their visual prominence reflects their relative importance in your analysis. I tried to provide flexible options for traders to control this indicator's visuals for that exact reason — not for window dressing.
█ LIMITATIONS
• This script uses a special characteristic of the `security()` function allowing the inspection of intrabars — which is not officially supported by TradingView.
It has the advantage of permitting a more robust calculation of volume delta than other methods on historical bars, but also has its limits.
• Intrabar inspection only works on some chart timeframes: 3, 5, 10, 15 and 30 minutes, 1, 2, 3, 4, 6, and 12 hours, 1 day, 1 week and 1 month.
The script’s code can be modified to run on other resolutions.
• When the difference between the chart’s timeframe and the intrabar timeframe is too great, runtime errors will occur. The Auto-Steps selection mechanisms should avoid this.
• All volume is not created equally. Its source, components, quality and reliability will vary considerably with sectors and instruments.
The higher the quality, the more reliably volume delta information can be used to guide your decisions.
You should make it your responsibility to understand the volume information provided in the data feeds you use. It will help you make the most of volume delta.
█ NOTES
For traders
• The Data Window shows key values for the indicator.
• While this indicator displays some of the same information calculated in my Delta Volume Columns ,
I have elected to make it a separate publication so that traders continue to have a simpler alternative available to them. Both code bases will continue to evolve separately.
• All gradients used in this indicator determine their brightness intensities using advances/declines in the signal—not their relative position in a pre-determined scale.
• Volume delta being relative, by nature, it is particularly well-suited to Forex markets, as it filters out quite elegantly the cyclical volume data characterizing the sector.
If you are interested in volume delta, consider having a look at my other "Delta Volume" indicators:
• Delta Volume Realtime Action displays realtime volume delta and tick information on the chart.
• Delta Volume Candles builds volume delta candles on the chart.
• Delta Volume Columns is a simpler version of this indicator.
For coders
• I use the `f_c_gradientRelativePro()` from the PineCoders Color Gradient Framework to build my gradients.
This function has the advantage of allowing begin/end colors for both the bull and bear colors. It also allows us to define the number of steps allowed for each gradient.
I use this to modulate the gradients so they perform optimally on the combination of the signal used to calculate advances/declines,
but also the nature of the visual component the gradient applies to. I use fewer steps for choppy signals and when the gradient is used on discrete visual components
such as volume columns or chart bars.
• I use the PineCoders Coding Conventions for Pine to write my scripts.
• I used functions modified from the PineCoders MTF Selection Framework for the selection of timeframes.
█ THANKS TO:
— The devs from TradingView's Pine and other teams, and the PineCoders who collaborate with them. They are doing amazing work,
and much of what this indicator does could not be done without their recent improvements to Pine.
— A guy called Kuan who commented on a Backtest Rookies presentation of their Volume Profile indicator using a `for` loop.
This indicator started from the intrabar inspection technique illustrated in Kuan's snippet.
— theheirophant , my partner in the exploration of the sometimes weird abysses of `security()`’s behavior at intrabar timeframes.
— midtownsk8rguy , my brilliant companion in mining the depths of Pine graphics.
Search in scripts for "Up down"

NYSE Volume UP FLOW VS Down FLOW ULTIMATE VOLDNYSE Volume UP FLOW VS Down FLOW ULTIMATE StokedStocks
BASED OFF THE VOLD INDEX
The VOLD (also $VOLD) is the difference between the up volume and down volume on the NYSE. i.e. NYSE $UVOL minus $DVOL; the net up volume.
If you consider that VOLD is the net value between UVOL (up volume) and DVOL (down volume) then you need to understand these two to understand VOLD.
UVOL or DVOL are a total of the volume on all stocks that are up or down in price. Up or down is based on the previous session's closing price. The size of the stock's price change is irrelevant.
If the stock is up only $.01, then its volume is grouped into the UVOL total. If that stock's price then drops by $.02 it will be down $.01 and the day's volume for that stock will now be grouped with the DVOL total.
Note that when a stock moves from being an up stock to a down stock its volume will be removed from the UVOL total and added to the DVOL total. Say the stocks volume is 1 million shares when it moves from up to down. The DVOL will increase by 1 million and the UVOL will decrease by 1 million which means that VOLD will decrease by 2 million.
NYSE Up/Down Volume Ratio is often used as a barometer for stocks trading on all U.S. Exchanges even though it is calculated based on stocks listed on the New York Stock Exchange.
NYSE Up/Down ratio represents the volume of NYSE stocks that are advancing divided by the volume of declining stocks.
The volume of advancing stocks or upside volume is the sum of the volume or the number of shares traded associated with stocks that closed higher.
The downside volume is the total number of shares traded that are associated with stocks that closed lower.
The interpretation of the NYSE Up/Down ratio is rather simple. A value higher than one indicates that there is more volume associated with up stocks than with down stocks and it is usually interpreted as a bullish signal.
Obviously, a bearish signal occurs when the NYSE Up/Down ratio is lower than one, which tells us that there are more volume associated with down stocks than with up stocks.
Check out my other indicators and website stokedstocks.wordpress.com for tons of free stock training books and pictures and settings

Market Internals [Makit0] MARKET INTERNALS INDICATOR v0.5beta
Market Internals are suitable for day trade equity indices, named SPY or /ES, please do your own research about what they are and how to use them
This scripts plots the NYSE market internals charts as an indicator for an easy and full visualization of market internal structure all in one chart, useful for SPY and /ES trading
Description of the Market Internals
- TICK: NYSE stocks ticking up vs stocks ticking down, extreme values may point to trend continuation on trending days or reversal in non trending days, example of extreme values can be 800 and 1000
- ADD: NYSE stocks going up vs stocks going down, if price auctions around the zero line may be a non trend day, otherwise may be a trend day
- VOLD: NYSE volume of stocks up vs volume of stocks going down, identify clearly where the volume is going, as example if volume is flowing down may be a good idea no to place longs
- TRIN: NYSE up stocks vs down stocks ratio divided by up volume vs down volume ratio. A value of 1 indicates parity, below that the strength is on the long side, above the strength is in the short side.
A basic use of market internals may be looking for divergences, for example:
- /ES is trading in a range but ADD and VOLD are trending up nonstop, may /ES will break the range to the upside
- /ES is trading in a range and ADD and VOLD are trading around the zero line but got an extreme reading on TICK, may be a non trending day and the TICK extreme reading is at one of the extremes of the /ES range, may be a good probability trade to fade that move
- /ES is trading in a trend to the downside, ADD and VOLD too, you catch a good portion of the move but are fearful to flat and miss more gains, you see in the TICK a lot of extreme values below -800 so your're confident in the continuation of the downtrend, until the TICK goes beyond -1000 and you use that signal to go flat
Market internals give you context and confirmation, price in /ES may be trending but if market internals do not confirm the move may a reversal is on its way
Price is an advertise, you can see the real move in the structure below, in the behavior of the individual components of the market, those are the real questions:
- How many stocks are going up/down (ADD)
- How many volume is flowing up/down (VOLD)
- How many stocks are ticking up/down (TICK)
- What is the overall volume breath of the market (TRIN)
FEATURES:
- Plot one of the four basic market internal indices: TICK, ADD, VOLD and TRIN
- Show labels with values beyond an user defined threshold
- Show ZERO line
- Show user defined Dotted and Dashed lines
- Show user defined moving average
SETTINGS:
- Market internal: ticker to plot in the indicator, four options to choose from (TICK, ADD, VOLD and TRIN)
- Labels threshold: all values beyond this will be ploted as labels
- Dot lines at: two dotted lines will be plotted at this value above and below the zero line
- Dash lines at: two dashed lines will be plotted at this value above and below the zero line
- MA type: two options avaiable SMA (Simple Moving Average) or EMA (Exponential Moving Average)
- MA length: number of bars to calculate the moving average
- Show zero line: show or hide zero line
- Show dot line: show or hide dotted lines
- Show dash line: show or hide dashed lines
- Show labels: show or hide labels
GOOD LUCK AND HAPPY TRADING

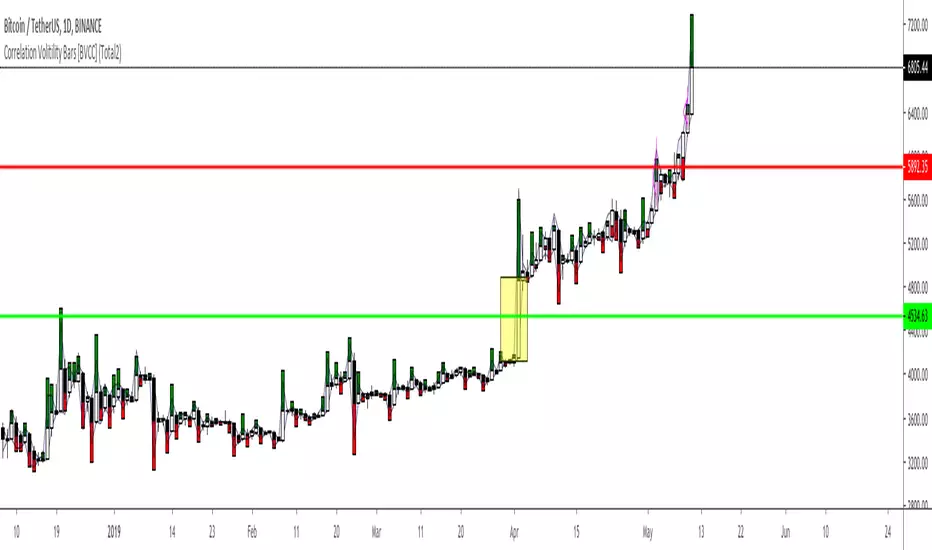
Correlation Volitility Bars [BVCC]This chart will allow you to compare the volatility of correlation of any other instrument to your current chart. When the comparison coin is selected, it will overlay your current bars with additional information that shows up/down correlation to your master chart as well the volatility of that correlation.
This can be used to compare other coins to BTC for a quick visual reference of if a coin moves with or against BTC movements. If the comparison coin moves up on the given bar, it is represented by a green histogram ABOVE of your current candle. If the comparison coin moves down, it is represented as a red histogram BELOW your current candle.
The height of the correlation candle represents the percentage that the comparison coin moved up or down. The longer the candle, the farther that coin moved.
The blue band represents a 'volatility reference'
-If your comparison coin stays within this band, then it is moving at an absolute rate which is less than the absolute rate of the master coin.
-If your comparison coin moves outside of this band, then it is moving at an absolute rate which is more than the absolute rate of the master coin.
A couple of example of how to read this;
*******Master Candle = Up | Comparison Candle = Up | Equal to Volatility Band********
This means that when the master went up, so did the comparison coin and they both moved equal amounts
******Master Candle = Up | Comparison Candle = Down | Outside Volatility Band*******
This means that when the master went up, the comparison coin went down in response and it's downward response was greater than the corresponding master up movement
******Master Candle = Up | Comparison Candle = Up | Outside Volatility Band*******
This means that when the master went up, the comparison candle responded by going up as well but made more % gains than the corresponding master candle.
Uses for this indicator would be research into the historical performance of how a specific coin reacts to BTC and whether it is a more or less profitable vehicle than BTC during that time period. If the price is consistently outside of the Volatility band then you can infer that this coin is hypersensitive to BTC movements. If the price is consistently within the bands, then you could infer that your comparison coin is relatively correlated or unfazed by BTC.
UltraTrends.V2This is version 2 of Ultratrends.
Like the last version:
Fuschia is pivot down, yellow is pivot up, up is confirmed up, down is confirmed down, green is uptrend, red is downtrend, gray is no trend.
"UP" Is a good indication that the market is going to go up. "DOWN" is a good indication that the market will go down. However, use your head. Think about support / resistance.
Additions:
- 200 EMA/SMA Average (Thick aqua line): Great for determining trend and acts as support / resistance.
- 50 SMA (thin yellow line): Use for 50/200 crosses to determine trend. Serves as weaker resistance.
- Dynamic Pivot points (by finn): Serve as support / resistance levels. Plotted as horizontal dots.
- Early move detection: demonstrated by either a green triangle below bar or red triangle above bar.
- "Hot Zones": volume based background highlighting the manifestation of bullish conditions. Default color is white, so if you use a lighter background, please change it to another color.
This indicator works best with 1337 Volume:
The only way to get this script is by joining Gambit Private Trading Room. There are currently ~ 90 experienced traders in the room at the time of this post that share the best ideas / setups. For more information, please fill out the form at: GambitCrypto.com
Enjoy

Pro trade by Amit// This work is licensed under Creative Commons Attribution-NonCommercial-ShareAlike 4.0 International License (CC BY-NC-SA 4.0) creativecommons.org
//@version=5
import HeWhoMustNotBeNamed/utils/1 as ut
import Trendoscope/ohlc/1 as o
import Trendoscope/LineWrapper/1 as wr
import Trendoscope/ZigzagLite/2 as zg
import Trendoscope/abstractchartpatterns/5 as p
import Trendoscope/basechartpatterns/6 as bp
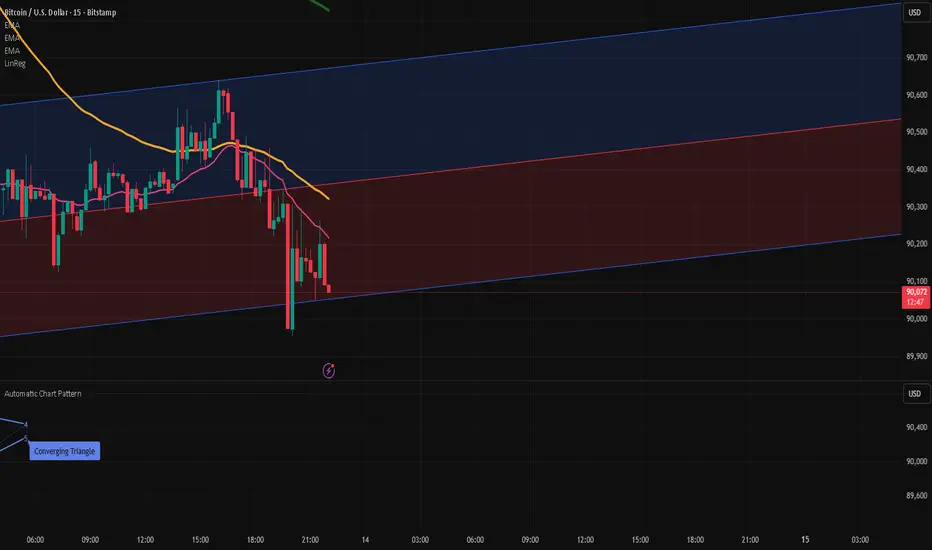
indicator("Installing Wait....", "Automatic Chart Pattern", overlay = true, max_lines_count=500, max_labels_count=500, max_polylines_count = 100)
openSource = input.source(open, '', inline='cs', group='Source', display = display.none)
highSource = input.source(high, '', inline='cs', group='Source', display = display.none)
lowSource = input.source(low, '', inline='cs', group='Source', display = display.none)
closeSource = input.source(close, '', inline='cs', group='Source', display = display.none, tooltip = 'Source on which the zigzag and pattern calculation is done')
useZigzag1 = input.bool(true, '', group = 'Zigzag', inline='z1', display = display.none)
zigzagLength1 = input.int(8, step=5, minval=1, title='', group='Zigzag', inline='z1', display=display.none)
depth1 = input.int(55, "", step=25, maxval=500, group='Zigzag', inline='z1', display=display.none, tooltip = 'Enable and set Length and Dept of Zigzag 1')
useZigzag2 = input.bool(false, '', group = 'Zigzag', inline='z2', display = display.none)
zigzagLength2 = input.int(13, step=5, minval=1, title='', group='Zigzag', inline='z2', display=display.none)
depth2 = input.int(34, "", step=25, maxval=500, group='Zigzag', inline='z2', display=display.none, tooltip = 'Enable and set Length and Dept of Zigzag 2')
useZigzag3 = input.bool(false, '', group = 'Zigzag', inline='z3', display = display.none)
zigzagLength3 = input.int(21, step=5, minval=1, title='', group='Zigzag', inline='z3', display=display.none)
depth3 = input.int(21, "", step=25, maxval=500, group='Zigzag', inline='z3', display=display.none, tooltip = 'Enable and set Length and Dept of Zigzag 3')
useZigzag4 = input.bool(false, '', group = 'Zigzag', inline='z4', display = display.none)
zigzagLength4 = input.int(34, step=5, minval=1, title='', group='Zigzag', inline='z4', display=display.none)
depth4 = input.int(13, "", step=25, maxval=500, group='Zigzag', inline='z4', display=display.none, tooltip = 'Enable and set Length and Dept of Zigzag 4')
numberOfPivots = input.int(5, "Number of Pivots", , 'Number of pivots used for pattern identification.', group='Scanning', display = display.none)
errorThresold = input.float(20.0, 'Error Threshold', 0.0, 100, 5, 'Error Threshold for trend line validation', group='Scanning', display = display.none)
flatThreshold = input.float(20.0, 'Flat Threshold', 0.0, 30, 5, 'Ratio threshold to identify the slope of trend lines', group='Scanning', display = display.none)
lastPivotDirection = input.string('both', 'Last Pivot Direction', , 'Filter pattern based on the last pivot direction. '+
'This option is useful while backtesting individual patterns. When custom is selected, then the individual pattern last pivot direction setting is used',
group='Scanning', display=display.none)
checkBarRatio = input.bool(true, 'Verify Bar Ratio ', 'Along with checking the price, also verify if the bars are proportionately placed.', group='Scanning', inline = 'br', display = display.none)
barRatioLimit = input.float(0.382, '', group='Scanning', display = display.none, inline='br')
avoidOverlap = input.bool(true, 'Avoid Overlap', group='Scanning', inline='a', display = display.none)
repaint = input.bool(false, 'Repaint', 'Avoid Overlap - Will not consider the pattern if it starts before the end of an existing pattern\n\n'+
'Repaint - Uses real time bars to search for patterns. If unselected, then only use confirmed bars.',
group='Scanning', inline='a', display = display.none)
allowChannels = input.bool(true, 'Channels', group='Pattern Groups - Geometric Shapes', display = display.none, inline='g')
allowWedges = input.bool(true, 'Wedge', group='Pattern Groups - Geometric Shapes', display = display.none, inline='g')
allowTriangles = input.bool(true, 'Triangle', group='Pattern Groups - Geometric Shapes', display = display.none, inline='g',
tooltip = 'Channels - Trend Lines are parralel to each other creating equidistance price channels'+
'\n\t- Ascending Channel\n\t- Descending Channel\n\t- Ranging Channel'+
'\n\nWedges - Trend lines are either converging or diverging from each other and both the trend lines are moving in the same direction'+
'\n\t- Rising Wedge (Expanding)\n\t- Rising Wedge (Contracting)\n\t- Falling Wedge (Expanding)\n\t- Falling Wedge (Contracting)'+
'\n\nTriangles - Trend lines are either converging or diverging from each other and both trend lines are moving in different directions'+
'\n\t- Converging Triangle\n\t- Diverging Triangle\n\t- Ascending Triangle (Contracting)\n\t- Ascending Triangle (Expanding)\n\t- Descending Triangle(Contracting)\n\t- Descending Triangle(Expanding)')
allowRisingPatterns = input.bool(true, 'Rising', group='Pattern Groups - Direction', display = display.none, inline = 'd')
allowFallingPatterns = input.bool(true, 'Falling', group='Pattern Groups - Direction', display = display.none, inline = 'd')
allowNonDirectionalPatterns = input.bool(true, 'Flat/Bi-Directional', group='Pattern Groups - Direction', display = display.none, inline = 'd',
tooltip = 'Rising - Either both trend lines are moving up or one trend line is flat and the other one is moving up.'+
'\n\t- Ascending Channel\n\t- Rising Wedge (Expanding)\n\t- Rising Wedge (Contracting)\n\t- Ascending Triangle (Expanding)\n\t- Ascending Triangle (Contracting)'+
'\n\nFalling - Either both trend lines are moving down or one trend line is flat and the other one is moving down.'+
'\n\t- Descending Channel\n\t- Falling Wedge (Expanding)\n\t- Falling Wedge (Contracting)\n\t- Descending Triangle (Expanding)\n\t- Descending Triangle (Contracting)'+
'\n\nFlat/Bi-Directional - Trend Lines move in different directions or both flat.'+
'\n\t- Ranging Channel\n\t- Converging Triangle\n\t- Diverging Triangle')
allowExpandingPatterns = input.bool(true, 'Expanding', group='Pattern Groups - Formation Dynamics', display = display.none, inline = 'f')
allowContractingPatterns = input.bool(true, 'Contracting', group='Pattern Groups - Formation Dynamics', display = display.none, inline='f')
allowParallelChannels = input.bool(true, 'Parallel', group = 'Pattern Groups - Formation Dynamics', display = display.none, inline = 'f',
tooltip = 'Expanding - Trend Lines are diverging from each other.'+
'\n\t- Rising Wedge (Expanding)\n\t- Falling Wedge (Expanding)\n\t- Ascending Triangle (Expanding)\n\t- Descending Triangle (Expanding)\n\t- Diverging Triangle'+
'\n\nContracting - Trend Lines are converging towards each other.'+
'\n\t- Rising Wedge (Contracting)\n\t- Falling Wedge (Contracting)\n\t- Ascending Triangle (Contracting)\n\t- Descending Triangle (Contracting)\n\t- Converging Triangle'+
'\n\nParallel - Trend Lines are almost parallel to each other.'+
'\n\t- Ascending Channel\n\t- Descending Channel\n\t- Ranging Channel')
allowUptrendChannel = input.bool(true, 'Ascending ', group = 'Price Channels', inline='uc', display = display.none)
upTrendChannelLastPivotDirection = input.string('both', '', , inline='uc', group='Price Channels', display = display.none,
tooltip='Enable Ascending Channel and select the last pivot direction filter. Last pivot direction will only be used if the Generic Last Pivot Direction parameter is set to Custom')
allowDowntrendChannel = input.bool(true, 'Descending', group = 'Price Channels', inline='dc', display = display.none)
downTrendChannelLastPivotDirection = input.string('both', '', , inline='dc', group='Price Channels', display = display.none,
tooltip='Enable Descending Channel and select the last pivot direction filter. Last pivot direction will only be used if the Generic Last Pivot Direction parameter is set to Custom')
allowRangingChannel = input.bool(true, 'Ranging ', group = 'Price Channels', inline='rc', display = display.none)
rangingChannelLastPivotDirection = input.string('both', '', , inline='rc', group='Price Channels', display = display.none,
tooltip='Enable Ranging Channel and select the last pivot direction filter. Last pivot direction will only be used if the Generic Last Pivot Direction parameter is set to Custom')
allowRisingWedgeExpanding = input.bool(true, 'Rising ', inline='rwe', group = 'Expanding Wedges', display = display.none)
risingWedgeExpandingLastPivotDirection = input.string('down', '', , inline='rwe', group='Expanding Wedges', display = display.none,
tooltip='Enable Rising Wedge (Expanding) and select the last pivot direction filter. Last pivot direction will only be used if the Generic Last Pivot Direction parameter is set to Custom')
allowFallingWedgeExpanding = input.bool(true, 'Falling ', inline='fwe', group = 'Expanding Wedges', display = display.none)
fallingWedgeExpandingLastPivotDirection = input.string('up', '', , inline='fwe', group='Expanding Wedges', display = display.none,
tooltip='Enable Falling Wedge (Expanding) and select the last pivot direction filter. Last pivot direction will only be used if the Generic Last Pivot Direction parameter is set to Custom')
allowRisingWedgeContracting = input.bool(true, 'Rising ', inline='rwc', group = 'Contracting Wedges', display = display.none)
risingWedgeContractingLastPivotDirection = input.string('down', '', , inline='rwc', group='Contracting Wedges', display = display.none,
tooltip='Enable Rising Wedge (Contracting) and select the last pivot direction filter. Last pivot direction will only be used if the Generic Last Pivot Direction parameter is set to Custom')
allowFallingWedgeContracting = input.bool(true, 'Falling ', inline='fwc', group = 'Contracting Wedges', display = display.none)
fallingWedgeContractingLastPivotDirection = input.string('up', '', , inline='fwc', group='Contracting Wedges', display = display.none,
tooltip='Enable Falling Wedge (Contracting) and select the last pivot direction filter. Last pivot direction will only be used if the Generic Last Pivot Direction parameter is set to Custom')
allowRisingTriangleExpanding = input.bool(true, 'Ascending ', inline='rte', group = 'Expanding Triangles', display = display.none)
risingTriangleExpandingLastPivotDirection = input.string('up', '', , inline='rte', group='Expanding Triangles', display = display.none,
tooltip='Enable Ascending Triangle (Expanding) and select the last pivot direction filter. Last pivot direction will only be used if the Generic Last Pivot Direction parameter is set to Custom')
allowFallingTriangleExpanding = input.bool(true, 'Descending', inline='fte', group = 'Expanding Triangles', display = display.none)
fallingTriangleExpandingLastPivotDirection = input.string('down', '', , inline='fte', group='Expanding Triangles', display = display.none,
tooltip='Enable Descending Triangle (Expanding) and select the last pivot direction filter. Last pivot direction will only be used if the Generic Last Pivot Direction parameter is set to Custom')
allowExpandingTriangle = input.bool(true, 'Diverging ', inline='dt', group = 'Expanding Triangles', display = display.none)
divergineTriangleLastPivotDirection = input.string('both', '', , inline='dt', group='Expanding Triangles', display = display.none,
tooltip='Enable Diverging Triangle and select the last pivot direction filter. Last pivot direction will only be used if the Generic Last Pivot Direction parameter is set to Custom')
allowRisingTriangleConverging= input.bool(true, 'Ascending ', inline='rtc', group = 'Contracting Triangles', display = display.none)
risingTriangleContractingLastPivotDirection = input.string('up', '', , inline='rtc', group='Contracting Triangles', display = display.none,
tooltip='Enable Ascending Triangle (Contracting) and select the last pivot direction filter. Last pivot direction will only be used if the Generic Last Pivot Direction parameter is set to Custom')
allowFallingTriangleConverging = input.bool(true, 'Descending', inline='ftc', group = 'Contracting Triangles', display = display.none)
fallingTriangleContractingLastPivotDirection = input.string('down', '', , inline='ftc', group='Contracting Triangles', display = display.none,
tooltip='Enable Descending Triangle (Contracting) and select the last pivot direction filter. Last pivot direction will only be used if the Generic Last Pivot Direction parameter is set to Custom')
allowConvergingTriangle = input.bool(true, 'Converging ', inline='ct', group = 'Contracting Triangles', display = display.none)
convergingTriangleLastPivotDirection = input.string('both', '', , inline='ct', group='Contracting Triangles', display = display.none,
tooltip='Enable Converging Triangle and select the last pivot direction filter. Last pivot direction will only be used if the Generic Last Pivot Direction parameter is set to Custom')
allowedPatterns = array.from(
false,
allowUptrendChannel and allowRisingPatterns and allowParallelChannels and allowChannels,
allowDowntrendChannel and allowFallingPatterns and allowParallelChannels and allowChannels,
allowRangingChannel and allowNonDirectionalPatterns and allowParallelChannels and allowChannels,
allowRisingWedgeExpanding and allowRisingPatterns and allowExpandingPatterns and allowWedges,
allowFallingWedgeExpanding and allowFallingPatterns and allowExpandingPatterns and allowWedges,
allowExpandingTriangle and allowNonDirectionalPatterns and allowExpandingPatterns and allowTriangles,
allowRisingTriangleExpanding and allowRisingPatterns and allowExpandingPatterns and allowTriangles,
allowFallingTriangleExpanding and allowFallingPatterns and allowExpandingPatterns and allowTriangles,
allowRisingWedgeContracting and allowRisingPatterns and allowContractingPatterns and allowWedges,
allowFallingWedgeContracting and allowFallingPatterns and allowContractingPatterns and allowWedges,
allowConvergingTriangle and allowNonDirectionalPatterns and allowContractingPatterns and allowTriangles,
allowFallingTriangleConverging and allowFallingPatterns and allowContractingPatterns and allowTriangles,
allowRisingTriangleConverging and allowRisingPatterns and allowContractingPatterns and allowTriangles
)
getLastPivotDirectionInt(lastPivotDirection)=>lastPivotDirection == 'up'? 1 : lastPivotDirection == 'down'? -1 : 0
allowedLastPivotDirections = array.from(
0,
lastPivotDirection == 'custom'? getLastPivotDirectionInt(upTrendChannelLastPivotDirection) : getLastPivotDirectionInt(lastPivotDirection),
lastPivotDirection == 'custom'? getLastPivotDirectionInt(downTrendChannelLastPivotDirection) : getLastPivotDirectionInt(lastPivotDirection),
lastPivotDirection == 'custom'? getLastPivotDirectionInt(rangingChannelLastPivotDirection) : getLastPivotDirectionInt(lastPivotDirection),
lastPivotDirection == 'custom'? getLastPivotDirectionInt(risingWedgeExpandingLastPivotDirection) : getLastPivotDirectionInt(lastPivotDirection),
lastPivotDirection == 'custom'? getLastPivotDirectionInt(fallingWedgeExpandingLastPivotDirection) : getLastPivotDirectionInt(lastPivotDirection),
lastPivotDirection == 'custom'? getLastPivotDirectionInt(divergineTriangleLastPivotDirection) : getLastPivotDirectionInt(lastPivotDirection),
lastPivotDirection == 'custom'? getLastPivotDirectionInt(risingTriangleExpandingLastPivotDirection) : getLastPivotDirectionInt(lastPivotDirection),
lastPivotDirection == 'custom'? getLastPivotDirectionInt(fallingTriangleExpandingLastPivotDirection) : getLastPivotDirectionInt(lastPivotDirection),
lastPivotDirection == 'custom'? getLastPivotDirectionInt(risingWedgeContractingLastPivotDirection) : getLastPivotDirectionInt(lastPivotDirection),
lastPivotDirection == 'custom'? getLastPivotDirectionInt(fallingWedgeContractingLastPivotDirection) : getLastPivotDirectionInt(lastPivotDirection),
lastPivotDirection == 'custom'? getLastPivotDirectionInt(convergingTriangleLastPivotDirection) : getLastPivotDirectionInt(lastPivotDirection),
lastPivotDirection == 'custom'? getLastPivotDirectionInt(fallingTriangleContractingLastPivotDirection) : getLastPivotDirectionInt(lastPivotDirection),
lastPivotDirection == 'custom'? getLastPivotDirectionInt(risingTriangleContractingLastPivotDirection) : getLastPivotDirectionInt(lastPivotDirection)
)
theme = input.string('Dark', title='Theme', options= , group='Display', inline='pc',
tooltip='Chart theme settings. Line and label colors are generted based on the theme settings. If dark theme is selected, '+
'lighter colors are used and if light theme is selected, darker colors are used.\n\n'+
'Pattern Line width - to be used for drawing pattern lines', display=display.none)
patternLineWidth = input.int(2, '', minval=1, inline='pc', group = 'Display', display = display.none)
showPatternLabel = input.bool(true, 'Pattern Label', inline='pl1', group = 'Display', display = display.none)
patternLabelSize = input.string(size.normal, '', , inline='pl1', group = 'Display', display = display.none,
tooltip = 'Option to display Pattern Label and select the size')
showPivotLabels = input.bool(true, 'Pivot Labels ', inline='pl2', group = 'Display', display = display.none, tooltip = 'Option to display pivot labels and select the size')
pivotLabelSize = input.string(size.normal, '', , inline='pl2', group = 'Display', display = display.none)
showZigzag = input.bool(true, 'Zigzag', inline='z', group = 'Display', display = display.none)
zigzagColor = input.color(color.blue, '', inline='z', group = 'Display', display = display.none, tooltip = 'Option to display zigzag within pattern and the default zigzag line color')
deleteOldPatterns = input.bool(true, 'Max Patterns', inline='do', group = 'Display', display = display.none)
maxPatterns = input.int(20, '', minval=1, step=5, inline = 'do', group = 'Display', display = display.none, tooltip = 'If selected, only last N patterns will be preserved on the chart.')
errorRatio = errorThresold/100
flatRatio = flatThreshold/100
showLabel = true
offset = 0
type Scanner
bool enabled
string ticker
string timeframe
p.ScanProperties sProperties
p.DrawingProperties dProperties
array patterns
array zigzags
method getZigzagAndPattern(Scanner this, int length, int depth, array ohlcArray, int offset=0)=>
var zg.Zigzag zigzag = zg.Zigzag.new(length, depth, 0)
var map lastDBar = map.new()
zigzag.calculate(array.from(highSource, lowSource))
var validPatterns = 0
mlzigzag = zigzag
if(zigzag.flags.newPivot)
while(mlzigzag.zigzagPivots.size() >= 6+offset)
lastBar = mlzigzag.zigzagPivots.first().point.index
lastDir = int(math.sign(mlzigzag.zigzagPivots.first().dir))
if(lastDBar.contains(mlzigzag.level)? lastDBar.get(mlzigzag.level) < lastBar : true)
lastDBar.put(mlzigzag.level, lastBar)
= mlzigzag.find(this.sProperties, this.dProperties, this.patterns, ohlcArray)
if(valid)
validPatterns+=1
currentPattern.draw()
this.patterns.push(currentPattern, maxPatterns)
alert('New Pattern Alert')
else
break
mlzigzag := mlzigzag.nextlevel()
true
method scan(Scanner this)=>
var array ohlcArray = array.new()
var array patterns = array.new()
ohlcArray.push(o.OHLC.new(openSource, highSource, lowSource, closeSource))
if(useZigzag1)
this.getZigzagAndPattern(zigzagLength1, depth1, ohlcArray)
if(useZigzag2)
this.getZigzagAndPattern(zigzagLength2, depth2, ohlcArray)
if(useZigzag3)
this.getZigzagAndPattern(zigzagLength3, depth3, ohlcArray)
if(useZigzag4)
this.getZigzagAndPattern(zigzagLength4, depth4, ohlcArray)
var scanner = Scanner.new(true, "", "",
p.ScanProperties.new(offset, numberOfPivots, errorRatio, flatRatio, checkBarRatio, barRatioLimit, avoidOverlap, allowedPatterns=allowedPatterns, allowedLastPivotDirections= allowedLastPivotDirections, themeColors = ut.getColors(theme)),
p.DrawingProperties.new(patternLineWidth, showZigzag, 1, zigzagColor, showPatternLabel, patternLabelSize, showPivotLabels, pivotLabelSize, deleteOnPop = deleteOldPatterns),
array.new())
if(barstate.isconfirmed or repaint)
scanner.scan()
In-Range Rolling SL
In-Range Rolling SL Indicator Guide
The In-Range Rolling SL indicator is a dynamic stop-loss system designed for intraday trading that identifies squeeze conditions and trade entry opportunities based on rolling price windows.
Core Concept
The indicator analyzes the highest high and lowest low over a defined lookback period (default: 2 candles) to establish an "in-range" zone. When price stays within this range without breaking either boundary, it creates a squeeze condition—signaling potential breakout opportunities.
Trading Strategy
Wait for the Squeeze Setup
The most effective approach is to wait for the in-range stop-loss squeeze to form. This occurs when both the long SL (green line) and short SL (red line) are active simultaneously, indicated by the yellow status dot (🟡) in the indicator table. Analyze the wick high/close relationship against the in-range SL while price remains compressed—this setup identifies which side is more likely to break first.
Entry Timing and Risk Management
Long Entry: Enter when a candle closes above the in-range short SL (red line) without any wick above it. This "perfect breakout candle" confirms bullish momentum. Your entry should be around the region, with your stop-loss placed just below the top of the breakout candle's high.
Short Entry: Enter when a candle closes below the in-range long SL (green line). The stop-loss for short trades should be set 34.26 points above your entry for appropriate risk protection.
Risk-Reward Considerations
If you enter at the low of a breakout candle, expect only 8.26 points of drawdown potential. However, if you accidentally go long and your stop gets hit, you'll experience the full in-range stop-loss distance as your loss.
Advanced Techniques
Failed Breakout Trap: If a follow-up candle doesn't make a higher high after the initial breakout, consider adding a "winner" for compensation rather than holding for a trap. When your buy-stop sits on top of the breakout candle high, this isn't a valid long trade setup.
Flip Trade Opportunity: In-range stop-loss attempts to flip often provide ideal entry points. If the up candle doesn't break the previous low, this validates the long continuation.
Long Scalp Trading: A failed long scalp can be traded if you missed the initial market open down-up-down trend. With a stop-loss of 34 points and potential profit exceeding 50 points, this provides favorable risk-reward ratios.
Sustained Loss Management: Stop-loss for long positions should target 26 points maximum loss. The indicator automatically invalidates stop-losses when price violates them, keeping your chart clean for the next setup.
-------------------------
In-Range Rolling SL Indicator Guide
The In-Range Rolling SL indicator is a dynamic stop-loss system designed for intraday trading that identifies squeeze conditions and breakout opportunities based on rolling price windows.
How the Indicator Works
The indicator tracks the highest high and lowest low over your selected lookback period (default: 2 candles) to establish dynamic support and resistance levels. These levels create an "in-range" zone that adapts as new price action develops.
Visual Components
Green Line (Long SL): The rolling window's lowest low - your stop-loss level for long positions
Red Line (Short SL): The rolling window's highest high - your stop-loss level for short positions
Status Indicators:
🟡 Yellow: Squeeze condition (both SLs active)
🟢 Green: Long-only setup
🔴 Red: Short-only setup
⚪ White: Neutral (no active SLs)
The Squeeze Setup Strategy
Step 1: Wait for the Squeeze
The most effective way to use the In-Range Rolling SL is to wait for the in-range stop-loss squeeze to form. During the squeeze, both the green and red lines are active, meaning price has stayed within the rolling window without breaking either boundary. This compression phase indicates that it's "go time" to prepare your trade.
While in the squeeze, analyze the wick high/close relationship against the in-range SL levels. This analysis helps you determine which side is more likely to split when the breakout occurs.
Step 2: Identify the Perfect Breakout
Long Breakout: A perfect breakout candle should close above the in-range stop-loss high (red line) without any wick above it. This clean breakout demonstrates strong momentum and reduces the risk of a false breakout.
Short Breakout: Look for a candle that closes below the in-range SL low (green line), indicating a short-side trade is coming up.
Step 3: Entry Execution
Long Entry: Your entry should be around the region of the breakout. Position your stop-loss just below the top of the breakout candle's high. This placement protects you from failed breakouts while giving the trade room to develop.
Short Entry: Enter as the candle closes below the in-range SL low. The stop-loss for short-side trades is typically 34.26 points of potential loss based on the indicator's measurements.
Risk-Reward Analysis
Entry at Breakout Low
If you enter here at the low of the breakout candle, you're looking at only 8.26 points of drawdown potential. This represents your best-case entry scenario.
Accidental Wrong-Side Entry
However, if you accidentally go long here and your stop gets hit, you'll experience the full in-range stop-loss distance as your loss. This emphasizes the importance of waiting for clear breakout confirmation.
Long Scalp Opportunity
A failed long scalp can be traded here if you missed the market open down-up-down trend. With a stop-loss of 34 points and potential profit greater than 50 points, this setup offers a favorable risk-reward ratio of approximately 1:1.5.
Advanced Trade Management
Failed Breakout Recognition
Follow-Up Candle Validation: If a follow-up candle did not make a higher high than the breakout candle, this could be a trap. Your buy-stop on top of the breakout candle high is not a valid long trade setup in this scenario. Consider adding a "winner" for compensation rather than holding through the potential reversal.
Flip Trade Opportunities
In-range stop-loss tries to flip to the other side often provide excellent entries. If the up candle did not break the previous low, this validates the long continuation and suggests the squeeze is resolving to the upside.
Sustained Position Management
Stop-Loss Guidelines: Stop-loss for long positions should be 26 points of maximum loss. The indicator table displays the delta (Δ) showing your real-time distance to the active stop-loss, helping you manage risk dynamically.
Entry Timing: Your entry should be around the region where the breakout confirms, rather than chasing price after a large move. In order to prepare your trade, position your stop-loss on top of the breakout candle's high for long trades.
Practical Example from the Chart
Looking at the MNQ1! chart, you can see multiple squeeze formations throughout the session. The most notable sequence shows:
An initial downtrend creating a squeeze setup
A perfect breakout candle closing above the red line without upper wick
The subsequent candle validating the move
Later, a failed breakout attempt that created a short opportunity
Multiple flip attempts that provided re-entry points for scalpers
The indicator's table in the top-right continuously updates with the current SL levels, gap size, candle size, and delta values - giving you all the information needed to assess each trade's risk-reward profile in real-time.

QuantMotions - TPR SentinelQuantMotions – TPR Sentinel
The TPR Sentinel Band is a full trade-assistant for discretionary traders.
It combines an adaptive trend engine, directional TPR logic, volume intelligence, ATR-based risk management, a brute-force parameter optimizer, and a modern on-chart UI (entries/TP/SL panel + stats). The goal: fewer fake flips, clearer trend shifts, and visually guided trade management.
1. Core Concept
The Sentinel Line is built from a blend of:
- SMA + EMA
- Midline of highest/lowest high/low (Kijun-style)
- Donchian-style mid close
On top of that, the script calculates a Directional TPR (Time-Price-Ratio):
- Short / medium / long slopes of price
- Normalized by ATR
- Converted into a trend state:
+1 = Uptrend
-1 = Downtrend
0 = Neutral / transition
Hysteresis (Flux) controls how easily the trend flips:
- Higher hysteresis → harder to reverse → fewer fake-outs in chop.
2. Signals, Filters & Volume Intelligence
Signals
- Trend Flip Long: TrendState changes from −1/0 → +1.
- Trend Flip Short: TrendState changes from +1/0 → −1.
Filters
- ADX Filter (optional):
- Only allows trades if ADX is above a chosen threshold.
- Avoids trading in flat, low-energy markets.
R:R Filter:
- Before any signal is accepted, the script checks whether the distance to TP1 is at least the configured Risk:Reward ratio relative to the distance to SL.
- Only if that minimum R:R is reached, a signal becomes valid.
Volume Intelligence & Clouds
- Aggregates up/down volume (optionally across multiple tickers you define).
- Builds Volume Clouds around the Sentinel Line:
a) Positive intensity → buying pressure (bullish cloud).
b) Negative intensity → selling pressure (bearish cloud).
Optional Volume Direction Filter:
- Long only when volume intensity ≥ 0.
- Short only when volume intensity ≤ 0.
3. Risk, Exits & Trailing Stop
The indicator includes a complete exit framework (for visual/manual trading):
Stop Loss Modes
- ATR Fixed: SL placed at a fixed ATR multiple from the entry.
- Trend Line (Dynamic): SL placed directly on the Sentinel Band (structural stop).
Take Profits
- TP1 – “safe target”:
a) Based on ATR distance.
b) Closes a configurable percentage of the position (e.g., 50%).
- TP2 (optional):
Second fixed target used only when Trailing Stop is OFF.
- Trend Runner Mode (Use TP = OFF):
Ignores fixed TP levels and rides the trend until the trend state flips.
Trailing Stop
- Activates after TP1 is hit (if enabled).
- Moves with price at a configurable ATR distance:
a) Long: trail creeps up under price.
b) Short: trail creeps down above price.
- Visually plotted as a purple trail line, dynamically replacing the original SL as the effective exit point.
Each trade is tracked internally and drawn as a green/red box with PnL labels between entry and exit.
4. UI & Stats
Candle Coloring (TRON Theme)
- Cyan = active uptrend & valid environment.
- Orange = active downtrend & valid environment.
Modern Trade Panel (on last bar)
- Live overlay of:
a) Entry
b) TP1
c) TP2
d) SL or active Trail (with dynamic label text: “SL (ATR)”, “SL (Struct)”, “TRAIL”)
Info label shows:
- Historical win rate in the current direction (Long/Short).
- Distance to SL, TP1, TP2 from current price.
- Box color blends from red → green depending on whether price is closer to SL or TP.
Stats Table (Bottom Right)
- Separate stats for Long and Short trades:
a) Win rate (%)
b) Cumulative PnL
Alerts
- Generates JSON alerts on signals, for example: {"side":"buy","ticker":"XYZ","price":123.45}
Perfect for webhooks, bots, or external automation.
5. Brute Force Optimizer (TPR Lab) – Important Limitations
The built-in Optimizer is a numerical helper, not a full strategy optimizer.
What it does:
- Runs brute-force simulations over a sliding window of historical data.
- Scans user-defined ranges for:
- Best Period (“Best Cycle”)
- Best Hysteresis (“Best Flux”)
Uses an efficiency score (average profit per trade) to rank combinations.
Displays results in the bottom-left TRON panel:
- Best Cycle
- Best Hysteresis
- Efficiency Score
What it does NOT optimize or take into account:
- It does not include your actual minimum R:R filter.
- It does not simulate or optimize your Stop Loss modes.
- It does not simulate Trailing Stops.
- It does not use the ADX filter.
- It does not use the Volume filters or Volume Clouds.
Because of this, the suggested “best” Period and Hysteresis are purely computational recommendations based on a simplified internal model.
In real trading, with your full setup (R:R filter, SL mode, Trailing, ADX, Volume confirmation, personal style), other parameter combinations can be superior to what the Optimizer suggests.
You should treat the Optimizer as:
A starting point or a research tool, not the final truth.
Always validate its suggestions visually, in the context of your full system and risk management.
6. Practical Usage
- Works on FX, indices, crypto, commodities – anything with decent liquidity.
- Scalping → use lower Period values, higher responsiveness.
- Swing → use higher Period values, more stability.
Recommended:
- Keep ADX filter ON to avoid dead markets.
- Use Volume Clouds as directional bias.
- Use the Info Panel and Stats to align with your own R:R and risk rules.
Disclaimer
This script is for educational/analytical purposes only and does not constitute financial advice. It does not execute trades or manage your risk automatically. Always combine it with your own strategy, money management, and independent decision-making.
Use the Info Panel and Stats to align with your own R:R and risk rules.

ACCDv3# ACCDv3 - Accumulation/Distribution MACD with Divergence Detection
## Overview
**ACCDv3** (Accumulation/Distribution MACD Version 3) is an advanced volume-weighted momentum indicator that combines the Accumulation/Distribution (A/D) line with MACD methodology and divergence detection. It helps identify trend strength, momentum shifts, and potential reversals by analyzing volume-weighted price movements.
## Key Features
- **Volume-Weighted MACD**: Applies MACD calculation to volume-weighted A/D values for earlier, more reliable signals
- **Divergence Detection**: Identifies when A/D trend diverges from MACD momentum
- **Volume Strength Filtering**: Distinguishes high-volume confirmations from low-volume noise
- **Color-Coded Histogram**: 4-color system showing momentum direction and volume strength
- **Real-Time Alerts**: Background colors and alert conditions for bullish/bearish divergences
## Components
### 1. Accumulation/Distribution (A/D) Line
The A/D line measures buying and selling pressure by comparing the close price to the trading range, weighted by volume:
```
A/D = Σ ((2 × Close - Low - High) / (High - Low)) × Volume
```
- **Rising A/D**: More accumulation (buying pressure)
- **Falling A/D**: More distribution (selling pressure)
- **Doji Handling**: When High = Low, contribution is zero (avoids division errors)
### 2. Volume-Weighted MACD
Instead of simple EMAs, the indicator weights A/D values by volume:
- **Fast Line** (default 12): `EMA(A/D × Volume, 12) / EMA(Volume, 12)`
- **Slow Line** (default 26): `EMA(A/D × Volume, 26) / EMA(Volume, 26)`
- **MACD Line**: Fast Line - Slow Line (green line)
- **Signal Line** (default 9): EMA or SMA of MACD (orange line)
- **Histogram**: MACD - Signal (color-coded columns)
This volume-weighting ensures that periods with higher volume have greater influence on the indicator values.
### 3. Histogram Color System
The histogram uses 4 distinct colors based on **direction** and **volume strength**:
| Condition | Color | Meaning |
|-----------|-------|---------|
| Rising + High Volume | **Dark Green** (#1B5E20) | Strong bullish momentum with volume confirmation |
| Rising + Low Volume | **Light Teal** (#26A69A) | Bullish momentum but weak volume (less reliable) |
| Falling + High Volume | **Dark Red** (#B71C1C) | Strong bearish momentum with volume confirmation |
| Falling + Low Volume | **Light Red/Pink** (#FFCDD2) | Bearish momentum but weak volume (less reliable) |
Additional shading:
- **Light Cyan** (#B2DFDB): Positive but not rising (momentum stalling)
- **Bright Red** (#FF5252): Negative and accelerating down
### 4. Divergence Detection
Divergence occurs when A/D trend and MACD momentum move in opposite directions:
#### Bullish Divergence (Green Background)
- **Condition**: A/D is trending up BUT MACD is negative and trending down
- **Interpretation**: Accumulation increasing while momentum appears weak
- **Signal**: Potential bullish reversal or continuation
- **Action**: Look for entry opportunities or hold long positions
#### Bearish Divergence (Red Background)
- **Condition**: A/D is trending down BUT MACD is positive and trending up
- **Interpretation**: Distribution increasing while momentum appears strong
- **Signal**: Potential bearish reversal or weakening uptrend
- **Action**: Consider exits, tighten stops, or prepare for reversal
## Parameters
| Parameter | Default | Range | Description |
|-----------|---------|-------|-------------|
| **Fast Length** | 12 | 1-50 | Period for fast EMA (shorter = more sensitive) |
| **Slow Length** | 26 | 1-100 | Period for slow EMA (longer = smoother) |
| **Signal Smoothing** | 9 | 1-50 | Period for signal line (MACD smoothing) |
| **Signal Line MA Type** | EMA | SMA/EMA | Moving average type for signal calculation |
| **Volume MA Length** | 20 | 5-100 | Period for volume average (strength filter) |
## Usage Guide
### Reading the Indicator
1. **MACD Lines (Green & Orange)**
- **Crossovers**: When green crosses above orange = bullish, below = bearish
- **Distance**: Wider gap = stronger momentum
- **Zero Line**: Above = bullish bias, below = bearish bias
2. **Histogram Colors**
- Focus on **dark colors** (dark green/red) for high-confidence signals
- Be cautious with **light colors** (teal/pink) - wait for volume confirmation
- Watch for **rising red bars** (V-bottom pattern) = potential bullish reversal
- Watch for **falling green bars** (Λ-top pattern) = potential bearish reversal
3. **Background Divergence Alerts**
- **Green background**: Bullish divergence - consider long entries
- **Red background**: Bearish divergence - consider exits or shorts
- Best used in combination with price action and support/resistance levels
### Trading Strategies
#### Trend Following
1. Wait for MACD to cross above zero line with dark green histogram
2. Enter long when histogram shows consecutive dark green bars
3. Exit when histogram turns light green or red appears
#### Divergence Trading
1. Wait for background divergence alert (green or red)
2. Confirm with price action (support/resistance, candlestick patterns)
3. Enter on next dark-colored histogram bar in divergence direction
4. Set stops beyond recent swing high/low
#### Volume Confirmation
1. Ignore signals during low-volume periods (light colors)
2. Take aggressive positions during high-volume confirmations (dark colors)
3. Use volume strength as position sizing guide (larger size on dark bars)
### Best Practices
✓ **Combine with price action**: Don't rely on indicator alone
✓ **Wait for dark colors**: High-volume bars are more reliable
✓ **Watch for divergences**: Early warning signs of reversals
✓ **Use multiple timeframes**: Confirm signals across 1m, 5m, 15m
✓ **Respect zero line**: Trading direction should align with MACD side
✗ **Don't chase light-colored signals**: Low volume = lower reliability
✗ **Don't ignore context**: Market structure and levels matter
✗ **Don't over-trade**: Wait for clear, high-volume setups
✗ **Don't ignore alerts**: Divergences are early warnings
## Technical Details
### Volume-Weighted Calculation Method
Traditional MACD uses simple price EMAs. ACCDv3 weights each A/D value by its corresponding volume:
```pine
// Volume-weighted fast EMA
close_vol_fast = ta.ema(ad × volume, fast_length)
vol_fast = ta.ema(volume, fast_length)
vw_ad_fast = close_vol_fast / vol_fast
// Same for slow EMA
close_vol_slow = ta.ema(ad × volume, slow_length)
vol_slow = ta.ema(volume, slow_length)
vw_ad_slow = close_vol_slow / vol_slow
// MACD is the difference
macd = vw_ad_fast - vw_ad_slow
```
This ensures high-volume periods have proportionally more impact on the indicator.
### Volume Strength Filter
Determines whether current volume is above or below average:
```pine
vol_avg = ta.sma(volume, vol_length)
vol_strength = volume > vol_avg
```
Used to select dark (high volume) vs light (low volume) histogram colors.
### Divergence Logic
```pine
// A/D trending up if above its 5-period SMA
ad_trend = ad > ta.sma(ad, 5)
// MACD trending up if above zero
macd_trend = macd > 0
// Divergence when trends oppose
divergence = ad_trend != macd_trend
// Specific conditions
bullish_divergence = ad_trend and not macd_trend and macd < 0
bearish_divergence = not ad_trend and macd_trend and macd > 0
```
## Alerts
The indicator includes built-in alert conditions:
- **Bullish Divergence**: "Bullish Divergence: A/D trending up but MACD trending down"
- **Bearish Divergence**: "Bearish Divergence: A/D trending down but MACD trending up"
To enable:
1. Click "Create Alert" button in TradingView
2. Select "ACCDv3" as condition
3. Choose "Bullish Divergence" or "Bearish Divergence"
4. Configure notification method (popup, email, webhook, etc.)
## Comparison with Standard MACD
| Feature | Standard MACD | ACCDv3 |
|---------|---------------|---------|
| **Input** | Close price | Accumulation/Distribution line |
| **Weighting** | Simple EMA | Volume-weighted EMA |
| **Divergence** | Price vs MACD | A/D vs MACD |
| **Volume Analysis** | None | Built-in strength filter |
| **Color System** | 2 colors (up/down) | 4+ colors (direction + volume) |
| **Leading/Lagging** | Lagging | More leading (volume-weighted) |
## Example Scenarios
### Scenario 1: Strong Bullish Signal
- **Chart**: MACD crosses above zero line
- **Histogram**: Dark green bars (#1B5E20) appearing
- **Volume**: Above 20-period average
- **Action**: Enter long, strong momentum with volume confirmation
### Scenario 2: Weak Bearish Signal
- **Chart**: MACD crosses below zero line
- **Histogram**: Light pink bars (#FFCDD2) appearing
- **Volume**: Below 20-period average
- **Action**: Avoid shorting, low volume = unreliable signal
### Scenario 3: Bullish Divergence Reversal
- **Chart**: Price making lower lows
- **Indicator**: A/D line trending up, MACD negative
- **Background**: Green shading appears
- **Histogram**: Transitions from red to dark green
- **Action**: Look for long entry on next dark green bar
### Scenario 4: V-Bottom Reversal
- **Chart**: Downtrend in place
- **Histogram**: Red bars start rising (becoming less negative)
- **Pattern**: Forms "V" shape at bottom
- **Confirmation**: Transitions to dark green bars
- **Action**: Bullish reversal signal, consider long entry
## Timeframe Recommendations
- **1-minute**: Scalping, very fast signals (noisy, use with caution)
- **5-minute**: Intraday momentum trading (recommended)
- **15-minute**: Swing entries, clearer trend signals
- **1-hour+**: Position trading, major trend identification
## Limitations
- **Requires volume data**: Will not work on instruments without volume
- **Lag during consolidation**: MACD is inherently trend-following
- **False signals in chop**: Sideways markets generate noise
- **Not a standalone system**: Should be combined with price action and risk management
## Version History
- **v3**: Removed traditional price MACD, using only volume-weighted A/D MACD with A/D divergence
- **v2**: Added A/D divergence detection, volume strength filtering, enhanced histogram colors
- **v1**: Basic MACD on A/D line with volume-weighted calculation
## Support & Further Reading
For questions, updates, or to report issues, refer to the main project documentation or contact the developer.
**Related Indicators in Suite:**
- **VMACDv3**: Volume-weighted MACD on price (not A/D)
- **RSIv2**: RSI with A/D divergence
- **DMI**: Directional Movement Index with A/D divergence
- **Elder Impulse**: Bar coloring system using volume-weighted MACD
---
*This indicator is for educational purposes. Always practice proper risk management and never risk more than you can afford to lose.*

CapitalFlowsResearch: Returns Regime MapCapitalFlowsResearch: Returns Regime Map — Two-Asset Behaviour & Correlation Lens
CapitalFlowsResearch: Returns Regime Map is a two-asset regime overlay that shows how a primary market and a linked macro series are really moving together over short rolling windows. Instead of just eyeballing two separate charts, the tool classifies each bar into one of four states based on the combined direction of recent returns:
Up / Up
Up / Down
Down / Up
Down / Down
These states are calculated from aggregated, windowed returns (using configurable return definitions for each asset), then painted directly onto the price chart as background regimes. On top of that, the indicator monitors the correlation of the same return streams and can optionally tint periods where correlation sits within a user-defined “low-correlation” band—highlighting moments when the usual relationship between the two series is weak, unstable, or breaking down.
In practice, this turns the chart into a compact co-movement map: you can see at a glance whether price and rates (or any two chosen markets) are trending together, diverging in a meaningful way, or moving in choppy, low-conviction fashion. It’s especially powerful for macro traders who need to frame trades in terms of “risk asset vs. rates,” “index vs. volatility,” or similar pairs—while keeping the actual construction details of the regime logic abstracted.

Historical SimilaritiesHappy trading! This tool provides short-term trend estimations. It is a further evolution of my earlier ANN Trend Prediction indicator, but it uses a completely new feature-vector composition and a different type of neural network.
1. Concept
The underlying idea is that history tends to repeat—not exactly, but with recognizable similarities. When recent market conditions resemble past situations, it is reasonable to assume that price may behave similarly again. That is the foundation of this indicator.
In the image below, you can see the general setup. The most recent bar (the “now” point) separates the past from the future. A sequence of recent bars is interpreted as a pattern and fed into a pre-trained LSTM network, which then produces the prediction for the current bar.
The focus of this tool is to deliver predictions as early as possible—ideally just before a trend reversal—to support short-term trades lasting approximately 5 to 20 bars. While perfect early detection is not reached here, this indicator often identifies reversals within one bar after they occur, which is usually early enough to capture meaningful moves.
There are other indicators capable of signaling trend reversals within a single bar—such as Shooting Star or Hammer candle patterns, or certain indicator setups. They were effective when they were new, but widespread use has reduced their reliability, and sometimes those patterns simply do not appear or appear without trend reversal.
This tool, by contrast, is new and it successfully identifies many trend reversals, as demonstrated in the image below:
2. Experimental Part
Furthermore, because this approach offers multiple settings that influence its behavior, you can configure it to focus on larger trends and ignore smaller fluctuations. The following images show several examples:
The default settings
with only-Body Smoothing enabled
with Generalized Trends enabled
with both Smoothing enabled
However, as you may notice, when targeting larger trends, a number of false-negative predictions may also appear. These still need to be filtered out. Please keep in mind that this version is experimental, requiring further investigation and research, and I would appreciate any feedback or suggestions.
3. Results
The prediction output is shown through a label and background colors as shown in the following image. It provides probabilities for three market directions:
Up - green
Sideways - blue
Down - red
When the model cannot confidently classify the current market conditions, it deliberately withholds a prediction and leaves the background uncolored. In most cases, however, it displays a label with all three probabilities whenever a new dominant prediction emerges, and it remains visible until the next dominant signal appears.
4. Conclusion
In its default settings, this indicator is quite capable when short-term trends last at least five or more bars. A support-and-resistance indicator can be helpful for setting take-profit and stop-loss levels.
5. Settings Menu
The script is delivered with its default settings, all turned off. However, several configuration options are available:
Input Preparation
Smoothing – Using Heikin Ashi or using only Bar Body are two methods that help remove outliers from the incoming bars.
Generalize Trends – Merges nearby trends together and removes smaller, insignificant trends.
Generalize Patterns – Checks the incoming pattern for artifacts and reduces it when possible. This is a trade-off between removing noise and keeping meaningful features.
Shifting – Examines the incoming pattern for consistency and adjusts it when reasonable.
Speed – Determines how quickly a prediction is calculated. A longer calculation time can improve accuracy, but may also risk the script timing out.
Filters
Intrabar – Off by default, allowing new dominant predictions only at bar close. When enabled, predictions may also be updated intrabar, but this introduces repainting on the current open bar.
Start of Classification – Sets the date from which classifications may begin.
Minimum Gains After Pattern – Defines how much price must rise or fall for a pattern to be considered an up, down, or sideways pattern.
Minimum Classification Probability – If the highest probability is below this threshold, no prediction is selected and the background stays translucent. If one probability exceeds the threshold, the largest one is chosen as the prediction.
Minimum Pattern Strength – Removes patterns whose strength is below this threshold.
6. Alert Signals Available
Trend Signal
2 = possible High
1 = Uptrend
0 = Ranging
-1 = Downtrend
-2 = possible Low
na = no prediction
Signal Age - counts the number of bars since last change
7. Declaration for TradingView House Rules on Script Publishing
The unique feature of the Historical Similarities Indicator is it's nearby real-time detection capability for up trends, down trends and side way price action in most cases.
This script is closed-source and invite-only, to support and compensate for years of development work.
8. Disclaimer
Trading involves risk, and losses can and do occur. This script is intended for informational and educational purposes only. All examples are hypothetical and not financial advice.
Decisions to buy, sell, hold, or trade securities, commodities, or other assets should be based on the advice of qualified financial professionals. Past performance does not guarantee future results.
Use this script at your own risk. It may contain bugs, and I cannot be held responsible for any financial losses resulting from its use.
Cheers!

RSI + BB + RSI Advanced MTF Panel//@version=6
indicator(title="RSI + BB + RSI Advanced MTF Panel", shorttitle="RSI + BB + RSI Advance MTF Panel", format=format.price, precision=2, overlay=false)
bb_group = "BB (Price Overlay)"
bb_length = input.int(50, minval=1, group = bb_group)
bb_maType = input.string("SMA", "Basis MA Type", options = , group = bb_group)
bb_src = input.source(close, title="Source", group = bb_group)
bb_mult = input.float(0.2, minval=0.001, maxval=50, title="StdDev", group = bb_group)
BasisColor = input.color(color.rgb(163, 41, 245), "Basis Color", group = bb_group, display = display.none)
UpperColor = input.color(color.rgb(120, 156, 202,100), "Upper Color", group = bb_group, display = display.none)
LowerColor = input.color(color.rgb(120, 156, 202,100), "Lower Color", group = bb_group, display = display.none)
offset = input.int(0, "Offset", minval = -500, maxval = 500, display = display.data_window, group = bb_group)
ma(source, bb_length, _type) =>
switch _type
"SMA" => ta.sma(source, bb_length)
"EMA" => ta.ema(source, bb_length)
"SMMA (RMA)" => ta.rma(source, bb_length)
"WMA" => ta.wma(source, bb_length)
"VWMA" => ta.vwma(source, bb_length)
basis = ma(bb_src, bb_length, bb_maType)
dev = bb_mult * ta.stdev(bb_src, bb_length)
upper = basis + dev
lower = basis - dev
plot(basis, "Basis", color=BasisColor, offset = offset, force_overlay = true)
p1 = plot(upper, "Upper", color=UpperColor, offset = offset, force_overlay = true)
p2 = plot(lower, "Lower", color=LowerColor, offset = offset, force_overlay = true)
fill(p1, p2, title = "Background", color=color.rgb(163, 41, 245, 90))
rsiLengthInput = input.int(30, minval=1, title="RSI Length", group="RSI Settings")
rsiSourceInput = input.source(close, "Source", group="RSI Settings")
calculateDivergence = input.bool(false, title="Calculate Divergence", group="RSI Settings", display = display.data_window, tooltip = "Calculating divergences is needed in order for divergence alerts to fire.")
SignalDot = input.bool(false, title="Signal Dot", group="Smoothing", display = display.data_window, tooltip = "Signal for possible entry")
change = ta.change(rsiSourceInput)
up = ta.rma(math.max(change, 0), rsiLengthInput)
down = ta.rma(-math.min(change, 0), rsiLengthInput)
rsi = down == 0 ? 100 : up == 0 ? 0 : 100 - (100 / (1 + up / down))
rsiPlot = plot(rsi, "RSI", color= rsi >= 51 ? color.rgb(13, 197, 230) : color.red)
rsiUpperBand = hline(70, "RSI Upper Band", color=#787B86)
midline = hline(50, "RSI Middle Band", color=color.new(#787B86, 50))
rsiLowerBand = hline(30, "RSI Lower Band", color=#787B86)
fill(rsiUpperBand, rsiLowerBand, color=color.rgb(126, 87, 194, 90), title="RSI Background Fill")
midLinePlot = plot(50, color = na, editable = false, display = display.none)
fill(rsiPlot, midLinePlot, 100, 70, top_color = color.new(color.green, 0), bottom_color = color.new(color.green, 100), title = "Overbought Gradient Fill")
fill(rsiPlot, midLinePlot, 30, 0, top_color = color.new(color.red, 100), bottom_color = color.new(color.red, 0), title = "Oversold Gradient Fill")
GRP = "Smoothing"
TT_BB = "Only applies when 'SMA + Bollinger Bands' is selected. Determines the distance between the SMA and the bands."
maTypeInput = input.string("SMA", "Type", options = , group = GRP, display = display.data_window)
maLengthInput = input.int(14, "Length", group = GRP, display = display.data_window)
bbMultInput = input.float(2.0, "BB StdDev", minval = 0.001, maxval = 50, step = 0.5, tooltip = TT_BB, group = GRP, display = display.data_window)
var enableMA = maTypeInput != "None"
var isBB = maTypeInput == "SMA + Bollinger Bands"
smoothma(source, length, MAtype) =>
switch MAtype
"SMA" => ta.sma(source, length)
"SMA + Bollinger Bands" => ta.sma(source, length)
"EMA" => ta.ema(source, length)
"SMMA (RMA)" => ta.rma(source, length)
"WMA" => ta.wma(source, length)
"VWMA" => ta.vwma(source, length)
smoothingMA = enableMA ? smoothma(rsi, maLengthInput, maTypeInput) : na
smoothingStDev = isBB ? ta.stdev(rsi, maLengthInput) * bbMultInput : na
plot(smoothingMA, "RSI-based MA", color=color.yellow, display = enableMA ? display.all : display.none, editable = enableMA)
bbUpperBand = plot(smoothingMA + smoothingStDev, title = "Upper Bollinger Band", color=color.green, display = isBB ? display.all : display.none, editable = isBB)
bbLowerBand = plot(smoothingMA - smoothingStDev, title = "Lower Bollinger Band", color=color.green, display = isBB ? display.all : display.none, editable = isBB)
fill(bbUpperBand, bbLowerBand, color= isBB ? color.new(color.green, 90) : na, title="Bollinger Bands Background Fill", display = isBB ? display.all : display.none, editable = isBB)
lookbackRight = 5
lookbackLeft = 5
rangeUpper = 60
rangeLower = 5
bearColor = color.red
bullColor = color.green
textColor = color.white
noneColor = color.new(color.white, 100)
_calcBarsSince(cond) =>
ta.barssince(cond)
rsiLBR = rsi
// 1. Calculate Pivots Unconditionally
plFound = not na(ta.pivotlow(rsi, lookbackLeft, lookbackRight))
phFound = not na(ta.pivothigh(rsi, lookbackLeft, lookbackRight))
// 2. Calculate History Unconditionally
barsSincePL = _calcBarsSince(plFound )
barsSincePH = _calcBarsSince(phFound )
// 3. Check Ranges Unconditionally
inRangePL = rangeLower <= barsSincePL and barsSincePL <= rangeUpper
inRangePH = rangeLower <= barsSincePH and barsSincePH <= rangeUpper
// 4. Calculate Conditions
var bool bullCond = false
var bool bearCond = false
if calculateDivergence
rsiHL = rsiLBR > ta.valuewhen(plFound, rsiLBR, 1) and inRangePL
lowLBR = low
priceLL = lowLBR < ta.valuewhen(plFound, lowLBR, 1)
bullCond := priceLL and rsiHL and plFound
rsiLH = rsiLBR < ta.valuewhen(phFound, rsiLBR, 1) and inRangePH
highLBR = high
priceHH = highLBR > ta.valuewhen(phFound, highLBR, 1)
bearCond := priceHH and rsiLH and phFound
else
bullCond := false
bearCond := false
plot(plFound ? rsiLBR : na, offset = -lookbackRight, title = "Regular Bullish", linewidth = 2, color = (bullCond ? bullColor : noneColor), display = display.pane, editable = calculateDivergence)
plotshape(bullCond ? rsiLBR : na, offset = -lookbackRight, title = "Regular Bullish Label", text = " Bull ", style = shape.labelup, location = location.absolute, color = bullColor, textcolor = textColor, display = display.pane, editable = calculateDivergence)
plot(phFound ? rsiLBR : na, offset = -lookbackRight, title = "Regular Bearish", linewidth = 2, color = (bearCond ? bearColor : noneColor), display = display.pane, editable = calculateDivergence)
plotshape(bearCond ? rsiLBR : na, offset = -lookbackRight, title = "Regular Bearish Label", text = " Bear ", style = shape.labeldown, location = location.absolute, color = bearColor, textcolor = textColor, display = display.pane, editable = calculateDivergence)
alertcondition(bullCond, title='Regular Bullish Divergence', message="Found a new Regular Bullish Divergence.")
alertcondition(bearCond, title='Regular Bearish Divergence', message='Found a new Regular Bearish Divergence.')
// --- Panel Options (General) ---
g_panel = 'MTF Panel Options'
i_orientation = input.string('Vertical', 'Orientation', options = , group = g_panel)
i_position = input.string('Bottom Right', 'Position', options = , group = g_panel)
i_border_width = input.int(1, 'Border Width', minval = 0, maxval = 10, group = g_panel, inline = 'border')
i_color_border = input.color(#000000, '', group = g_panel, inline = 'border')
i_showHeaders = input.bool(true, 'Show Headers', group = g_panel)
i_color_header_bg = input.color(#5d606b, 'Headers Background', group = g_panel, inline = 'header')
i_color_header_text = input.color(color.white, 'Text', group = g_panel, inline = 'header')
i_color_tf_bg = input.color(#2a2e39, 'Timeframe Background', group = g_panel, inline = 'tf')
i_color_tf_text = input.color(color.white, 'Text', group = g_panel, inline = 'tf')
i_debug = input.bool(false, 'Display colors palette (debug)', group = g_panel)
// --- RSI Colors (Conditional Formatting) ---
g_rsi = 'MTF RSI Colors'
i_threshold_ob = input.int(70, 'Overbought Threshold', minval=51, maxval=100, group = g_rsi)
i_color_ob = input.color(#128416, 'Overbought Background', inline = 'ob', group = g_rsi)
i_tcolor_ob = input.color(color.white, 'Text', inline = 'ob', group = g_rsi)
i_threshold_uptrend = input.int(60, 'Uptrend Threshold', minval=51, maxval=100, group = g_rsi)
i_color_uptrend = input.color(#2d472e, 'Uptrend Background', inline = 'up', group = g_rsi)
i_tcolor_uptrend = input.color(color.white, 'Text', inline = 'up', group = g_rsi)
i_color_mid = input.color(#131722, 'No Trend Background', group = g_rsi, inline = 'mid')
i_tcolor_mid = input.color(#b2b5be, 'Text', group = g_rsi, inline = 'mid')
i_threshold_downtrend = input.int(40, 'Downtrend Threshold', group = g_rsi, minval=0, maxval=49)
i_color_downtrend = input.color(#5b2e2e, 'Downtrend Background', group = g_rsi, inline = 'down')
i_tcolor_downtrend = input.color(color.white, 'Text', group = g_rsi, inline = 'down')
i_threshold_os = input.int(30, 'Oversold Threshold', minval=0, maxval=49, group = g_rsi)
i_color_os = input.color(#db3240, 'Oversold Background', group = g_rsi, inline = 'os')
i_tcolor_os = input.color(color.white, 'Text', group = g_rsi, inline = 'os')
// --- Individual RSI Settings (MTF Sources) ---
g_rsi1 = 'RSI #1'
i_rsi1_enabled = input.bool(true, title = 'Enabled', group = g_rsi1)
i_rsi1_tf = input.timeframe('5', 'Timeframe', group = g_rsi1)
i_rsi1_len = input.int(30, 'Length', minval = 1, group = g_rsi1)
i_rsi1_src = input.source(close, 'Source', group = g_rsi1) * 10000
v_rsi1 = i_rsi1_enabled ? request.security(syminfo.tickerid, i_rsi1_tf, ta.rsi(i_rsi1_src, i_rsi1_len)) : na
g_rsi2 = 'RSI #2'
i_rsi2_enabled = input.bool(true, title = 'Enabled', group = g_rsi2)
i_rsi2_tf = input.timeframe('15', 'Timeframe', group = g_rsi2)
i_rsi2_len = input.int(30, 'Length', minval = 1, group = g_rsi2)
i_rsi2_src = input.source(close, 'Source', group = g_rsi2) * 10000
v_rsi2 = i_rsi2_enabled ? request.security(syminfo.tickerid, i_rsi2_tf, ta.rsi(i_rsi2_src, i_rsi2_len)) : na
g_rsi3 = 'RSI #3'
i_rsi3_enabled = input.bool(true, title = 'Enabled', group = g_rsi3)
i_rsi3_tf = input.timeframe('60', 'Timeframe', group = g_rsi3)
i_rsi3_len = input.int(30, 'Length', minval = 1, group = g_rsi3)
i_rsi3_src = input.source(close, 'Source', group = g_rsi3) * 10000
v_rsi3 = i_rsi3_enabled ? request.security(syminfo.tickerid, i_rsi3_tf, ta.rsi(i_rsi3_src, i_rsi3_len)) : na
g_rsi4 = 'RSI #4'
i_rsi4_enabled = input.bool(true, title = 'Enabled', group = g_rsi4)
i_rsi4_tf = input.timeframe('240', 'Timeframe', group = g_rsi4)
i_rsi4_len = input.int(30, 'Length', minval = 1, group = g_rsi4)
i_rsi4_src = input.source(close, 'Source', group = g_rsi4) * 10000
v_rsi4 = i_rsi4_enabled ? request.security(syminfo.tickerid, i_rsi4_tf, ta.rsi(i_rsi4_src, i_rsi4_len)) : na
g_rsi5 = 'RSI #5'
i_rsi5_enabled = input.bool(true, title = 'Enabled', group = g_rsi5)
i_rsi5_tf = input.timeframe('D', 'Timeframe', group = g_rsi5)
i_rsi5_len = input.int(30, 'Length', minval = 1, group = g_rsi5)
i_rsi5_src = input.source(close, 'Source', group = g_rsi5) * 10000
v_rsi5 = i_rsi5_enabled ? request.security(syminfo.tickerid, i_rsi5_tf, ta.rsi(i_rsi5_src, i_rsi5_len)) : na
g_rsi6 = 'RSI #6'
i_rsi6_enabled = input.bool(true, title = 'Enabled', group = g_rsi6)
i_rsi6_tf = input.timeframe('W', 'Timeframe', group = g_rsi6)
i_rsi6_len = input.int(30, 'Length', minval = 1, group = g_rsi6)
i_rsi6_src = input.source(close, 'Source', group = g_rsi6) * 10000
v_rsi6 = i_rsi6_enabled ? request.security(syminfo.tickerid, i_rsi6_tf, ta.rsi(i_rsi6_src, i_rsi6_len)) : na
g_rsi7 = 'RSI #7'
i_rsi7_enabled = input.bool(false, title = 'Enabled', group = g_rsi7)
i_rsi7_tf = input.timeframe('W', 'Timeframe', group = g_rsi7)
i_rsi7_len = input.int(30, 'Length', minval = 1, group = g_rsi7)
i_rsi7_src = input.source(close, 'Source', group = g_rsi7) * 10000
v_rsi7 = i_rsi7_enabled ? request.security(syminfo.tickerid, i_rsi7_tf, ta.rsi(i_rsi7_src, i_rsi7_len)) : na
g_rsi8 = 'RSI #8'
i_rsi8_enabled = input.bool(false, title = 'Enabled', group = g_rsi8)
i_rsi8_tf = input.timeframe('W', 'Timeframe', group = g_rsi8)
i_rsi8_len = input.int(30, 'Length', minval = 1, group = g_rsi8)
i_rsi8_src = input.source(close, 'Source', group = g_rsi8) * 10000
v_rsi8 = i_rsi8_enabled ? request.security(syminfo.tickerid, i_rsi8_tf, ta.rsi(i_rsi8_src, i_rsi8_len)) : na
g_rsi9 = 'RSI #9'
i_rsi9_enabled = input.bool(false, title = 'Enabled', group = g_rsi9)
i_rsi9_tf = input.timeframe('W', 'Timeframe', group = g_rsi9)
i_rsi9_len = input.int(30, 'Length', minval = 1, group = g_rsi9)
i_rsi9_src = input.source(close, 'Source', group = g_rsi9) * 10000
v_rsi9 = i_rsi9_enabled ? request.security(syminfo.tickerid, i_rsi9_tf, ta.rsi(i_rsi9_src, i_rsi9_len)) : na
g_rsi10 = 'RSI #10'
i_rsi10_enabled = input.bool(false, title = 'Enabled', group = g_rsi10)
i_rsi10_tf = input.timeframe('W', 'Timeframe', group = g_rsi10)
i_rsi10_len = input.int(30, 'Length', minval = 1, group = g_rsi10)
i_rsi10_src = input.source(close, 'Source', group = g_rsi10) * 10000
v_rsi10 = i_rsi10_enabled ? request.security(syminfo.tickerid, i_rsi10_tf, ta.rsi(i_rsi10_src, i_rsi10_len)) : na
// --- Panel Helper Functions ---
// Function 4: String Position to Constant (Indentation cleaned)
f_StrPositionToConst(_p) =>
switch _p
'Top Left' => position.top_left
'Top Right' => position.top_right
'Top Center' => position.top_center
'Middle Left' => position.middle_left
'Middle Right' => position.middle_right
'Middle Center' => position.middle_center
'Bottom Left' => position.bottom_left
'Bottom Right' => position.bottom_right
'Bottom Center' => position.bottom_center
=> position.bottom_right
// Function 5: Timeframe to Human Readable (Indentation cleaned)
f_timeframeToHuman(_tf) =>
seconds = timeframe.in_seconds(_tf)
if seconds < 60
_tf
else if seconds < 3600
str.tostring(seconds / 60) + 'm'
else if seconds < 86400
str.tostring(seconds / 60 / 60) + 'h'
else
switch _tf
"1D" => "D"
"1W" => "W"
"1M" => "M"
=> str.tostring(_tf)
type TPanel
table src = na
bool vertical_orientation = true
int row = 0
int col = 0
// Method 1: Increment Column (Indentation cleaned)
method incCol(TPanel _panel) =>
if _panel.vertical_orientation
_panel.col += 1
else
_panel.row += 1
// Method 2: Increment Row (Indentation cleaned)
method incRow(TPanel _panel) =>
if not _panel.vertical_orientation
_panel.col += 1
_panel.row := 0
else
_panel.row += 1
_panel.col := 0
// Method 3: Add Cell (Indentation cleaned)
method add(TPanel _panel, string _v1, color _bg1, color _ctext1, string _v2, color _bg2, color _ctext2) =>
table.cell(_panel.src, _panel.col, _panel.row, _v1, text_color = _ctext1, bgcolor = _bg1)
_panel.incCol()
table.cell(_panel.src, _panel.col, _panel.row, _v2, text_color = _ctext2, bgcolor = _bg2)
_panel.incRow()
// Function 6: Background Color
f_bg(_rsi) =>
c_line = na(_rsi) ? i_color_mid :
_rsi >= i_threshold_ob ? i_color_ob :
_rsi >= i_threshold_uptrend ? i_color_uptrend :
_rsi <= i_threshold_os ? i_color_os :
_rsi <= i_threshold_downtrend ? i_color_downtrend :
i_color_mid
// Function 7: Text Color
f_rsi_text_color(_rsi) =>
c_line = na(_rsi) ? i_tcolor_mid :
_rsi >= i_threshold_ob ? i_tcolor_ob :
_rsi >= i_threshold_uptrend ? i_tcolor_uptrend :
_rsi <= i_threshold_os ? i_tcolor_os :
_rsi <= i_threshold_downtrend ? i_tcolor_downtrend :
i_tcolor_mid
f_formatRsi(_rsi) => na(_rsi) ? 'N/A' : str.tostring(_rsi, '0.00')
// --- Panel Execution Logic ---
if barstate.islast
v_panel = TPanel.new(vertical_orientation = i_orientation == 'Vertical')
v_max_rows = 20
v_panel.src := table.new(f_StrPositionToConst(i_position), v_max_rows, v_max_rows, border_width = i_border_width, border_color = i_color_border)
if i_showHeaders
v_panel.add('TF', i_color_header_bg, i_color_header_text, 'RSI', i_color_header_bg, i_color_header_text)
if i_rsi1_enabled
v_panel.add(f_timeframeToHuman(i_rsi1_tf), i_color_tf_bg, i_color_tf_text, f_formatRsi(v_rsi1), f_bg(v_rsi1), f_rsi_text_color(v_rsi1))
if i_rsi2_enabled
v_panel.add(f_timeframeToHuman(i_rsi2_tf), i_color_tf_bg, i_color_tf_text, f_formatRsi(v_rsi2), f_bg(v_rsi2), f_rsi_text_color(v_rsi2))
if i_rsi3_enabled
v_panel.add(f_timeframeToHuman(i_rsi3_tf), i_color_tf_bg, i_color_tf_text, f_formatRsi(v_rsi3), f_bg(v_rsi3), f_rsi_text_color(v_rsi3))
if i_rsi4_enabled
v_panel.add(f_timeframeToHuman(i_rsi4_tf), i_color_tf_bg, i_color_tf_text, f_formatRsi(v_rsi4), f_bg(v_rsi4), f_rsi_text_color(v_rsi4))
if i_rsi5_enabled
v_panel.add(f_timeframeToHuman(i_rsi5_tf), i_color_tf_bg, i_color_tf_text, f_formatRsi(v_rsi5), f_bg(v_rsi5), f_rsi_text_color(v_rsi5))
if i_rsi6_enabled
v_panel.add(f_timeframeToHuman(i_rsi6_tf), i_color_tf_bg, i_color_tf_text, f_formatRsi(v_rsi6), f_bg(v_rsi6), f_rsi_text_color(v_rsi6))
if i_rsi7_enabled
v_panel.add(f_timeframeToHuman(i_rsi7_tf), i_color_tf_bg, i_color_tf_text, f_formatRsi(v_rsi7), f_bg(v_rsi7), f_rsi_text_color(v_rsi7))
if i_rsi8_enabled
v_panel.add(f_timeframeToHuman(i_rsi8_tf), i_color_tf_bg, i_color_tf_text, f_formatRsi(v_rsi8), f_bg(v_rsi8), f_rsi_text_color(v_rsi8))
if i_rsi9_enabled
v_panel.add(f_timeframeToHuman(i_rsi9_tf), i_color_tf_bg, i_color_tf_text, f_formatRsi(v_rsi9), f_bg(v_rsi9), f_rsi_text_color(v_rsi9))
if i_rsi10_enabled
v_panel.add(f_timeframeToHuman(i_rsi10_tf), i_color_tf_bg, i_color_tf_text, f_formatRsi(v_rsi10), f_bg(v_rsi10), f_rsi_text_color(v_rsi10))
if i_debug
t = table.new(position.middle_center, 21, 20, border_width = i_border_width, border_color = i_color_border)
v_panel2 = TPanel.new(t, vertical_orientation = i_orientation == 'Vertical')
v_panel2.add('Debug', i_color_header_bg, i_color_header_text, 'Colors', i_color_header_bg, i_color_header_text)
// Using a tuple array for debugging colors demo
// Final Syntax Correction: Use array.new() and array.set() to avoid 'tuple()' function reference error
v_rows = 5 // We know we have 5 elements
demo = array.new(v_rows, '') // Initialize array with 5 string elements, will hold string representation of the tuple
// We will push the elements as a *string* representation of the tuple, as Pine v6 allows
// and then parse them inside the loop if necessary.
// To preserve the structure (string, float) without the tuple() function:
// We must define two separate arrays if the 'tuple' function is truly unavailable.
tf_array = array.new(v_rows)
rsi_array = array.new(v_rows)
// Populate the arrays
array.set(tf_array, 0, 'Overbought')
array.set(rsi_array, 0, float(i_threshold_ob))
array.set(tf_array, 1, 'Uptrend')
array.set(rsi_array, 1, float(i_threshold_uptrend))
array.set(tf_array, 2, 'No Trend')
array.set(rsi_array, 2, 50.0)
array.set(tf_array, 3, 'Downtrend')
array.set(rsi_array, 3, float(i_threshold_downtrend))
array.set(tf_array, 4, 'Oversold')
array.set(rsi_array, 4, float(i_threshold_os))
// Iterate over the arrays using a simple index
for i = 0 to v_rows - 1
tf = array.get(tf_array, i)
rsi = array.get(rsi_array, i)
v_panel2.add(tf, i_color_tf_bg, i_color_tf_text, f_formatRsi(rsi), f_bg(rsi), f_rsi_text_color(rsi))

NIFTY Weekly Option Seller DirectionalHere’s a straight description you can paste into the TradingView “Description” box and tweak if needed:
---
### NIFTY Weekly Option Seller – Regime + Score + Management (Single TF)
This indicator is built for **weekly option sellers** (primarily NIFTY) who want a **structured regime + scoring framework** to decide:
* Whether to trade **Iron Condor (IC)**, **Put Credit Spread (PCS)** or **Call Credit Spread (CCS)**
* How strong that regime is on the current timeframe (score 0–5)
* When to **DEFEND** existing positions and when to **HARVEST** profits
> **Note:** This is a **single timeframe** tool. The original system uses it on **4H and 1D separately**, then combines scores manually (e.g., using `min(4H, 1D)` for conviction and lot sizing).
---
## Core logic
The script classifies the market into 3 regimes:
* **IC (Iron Condor)** – range/mean-reversion conditions
* **PCS (Put Credit Spread)** – bullish/trend-up conditions
* **CCS (Call Credit Spread)** – bearish/trend-down conditions
For each regime, it builds a **0–5 score** using:
* **EMA stack (8/13/34)** – trend structure
* **ADX (custom DMI-based)** – trend strength vs range
* **Previous-day CPR** – in CPR vs break above/below
* **VWAP (session)** – near/far value
* **Camarilla H3/L3** – for IC context
* **RSI (14)** – used as a **brake**, not a primary signal
* **Daily trend / Daily ADX** – used as **hard gates**, not double-counted as extra points
Then:
* Scores for PCS / CCS / IC are **cross-penalised** (they pull each other down if conflicting)
* Final scores are **smoothed** (current + previous bar) to avoid jumpy signals
The **background colour** shows the current regime and conviction:
* Blue = IC
* Green = PCS
* Red = CCS
* Stronger tint = higher regime score
---
## Scoring details (per timeframe)
**PCS (uptrend, bullish credit spreads)**
* +2 if EMA(8) > EMA(13) > EMA(34)
* +1 if ADX > ADX_TREND
* +1 if close > CPR High
* +1 if close > VWAP
* RSI brake:
* If RSI < 50 → PCS capped at 2
* If RSI > 75 → PCS capped at 3
* Daily gating:
* If daily EMA stack is **not** uptrend → PCS capped at 2
**CCS (downtrend, bearish credit spreads)**
* +2 if EMA(8) < EMA(13) < EMA(34)
* +1 if ADX > ADX_TREND
* +1 if close < CPR Low
* +1 if close < VWAP
* RSI brake:
* If RSI > 50 → CCS capped at 2
* If RSI < 25 → CCS capped at 3
* Daily gating:
* If daily EMA stack is **not** downtrend → CCS capped at 2
**IC (range / mean-reversion)**
* +2 if ADX < ADX_RANGE (low trend)
* +1 if close inside CPR
* +1 if near VWAP
* +0.5 if inside Camarilla H3–L3
* +1 if daily ADX < ADX_RANGE (daily also range-like)
* +0.5 if RSI between 45 and 55 (classic balance zone)
* Daily gating:
* If daily ADX ≥ ADX_TREND → IC capped at 2 (no “strong IC” in strong trends)
**Cross-penalty & smoothing**
* Each regime’s raw score is reduced by **0.5 × max(other two scores)**
* Final IC / PCS / CCS scores are then **smoothed** with previous bar
* Scores are always clipped to ** **
---
## Regime selection
* If one regime has the highest score → that regime is selected.
* If there is a tie or close scores:
* When ADX is high, trend regimes (PCS/CCS) are preferred in the direction of the EMA stack.
* When ADX is low, IC is preferred.
The selected regime’s score is used for:
* Background colour intensity
* Minimum score gate for alerts
* Display in the info panel
---
## DEFEND / HARVEST / REGIME alerts
The script also defines **management signals** using ATR-based buffers and Camarilla breaks:
* **DEFEND**
* Price moving too close to short strikes (PCS/CCS/IC) relative to ATR, or
* Trend breaks through Camarilla with ADX strong
→ Suggests rolling away / widening / converting to reduce risk.
* **HARVEST**
* Price has moved far enough from your short strikes (in ATR multiples) and market is still range-compatible
→ Suggests booking profits / rolling closer / reducing risk.
* **REGIME CHANGED**
* Regime flips (IC ↔ PCS/CCS) with cooldown and minimum score gate
→ Suggests switching playbook (range vs trend) for new entries.
Each of these has a plotshape label plus an `alertcondition()` for TradingView alerts.
---
## UI / Panel
The **top-right panel** (optional) shows:
* Strategy + final regime score (IC / PCS / CCS, x/5)
* ADX / RSI values
* CPR status (Narrow / Normal / Wide + %)
* EMA Stack (Up / Down / Mixed) and EMA tightness
* VWAP proximity (Near / Away)
* Final **IC / PCS / CCS** scores (for this timeframe)
* H3/L3, H4/L4, CPR Low/High and VWAP levels (rounded)
These values are meant to be **read quickly at the decision time** (e.g. near the close of the 4H bar or daily bar).
---
## Intended workflow
1. Run the script on **4H** and **1D** charts separately.
2. For each timeframe, read the panel’s **IC / PCS / CCS scores** and regime.
3. Decide:
* Final regime (IC vs PCS vs CCS)
* Combined score (e.g. `AlignScore = min(Score_4H, Score_1D)`)
4. Map that combined score to **your own lot-size buckets** and trade rules.
5. During the life of the position, use **DEFEND / HARVEST / REGIME** alerts to adjust.
The script does **not** auto-calculate lot size or P&L. It focuses on giving a structured, consistent **market regime + strength + levels + management** layer for weekly option selling.
---
## Disclaimer
This is a discretionary **decision-support tool**, not a guarantee of profit or a replacement for risk management.
No performance is implied or promised. Always size positions and manage risk according to your own capital, rules, and regulations.

Trend BG v2Trend BG v2 colors the chart background based on Directional Movement (DM) and DI strength. It provides an easy visual way to identify trending and non-trending conditions on any timeframe.
How It Works
The script calculates:
Upward Directional Movement (DM+)
Downward Directional Movement (DM–)
True Range smoothed with RMA (14-period)
Positive DI and Negative DI values from classic ADX logic
The trend state is determined by comparing +DI vs –DI:
+DI > –DI → Uptrend
–DI > +DI → Downtrend
Otherwise → Neutral / Sideways
The script then applies a background color based on the detected trend.
Color transparency and theme can be adjusted using the input options.
Why This Script Is Useful
Instead of plotting DI lines or ADX curves, this version presents the trend directly on the background, making it ideal for:
Quick trend recognition
Visual filtering of choppy vs trending markets
Enhancing manual or automated setups
Intraday scalping, positional trend following, and multi-timeframe analysis
The background display is subtle, customizable, and does not interfere with other indicators on the chart.
Key Features
Trend-colored chart background (Up / Down / Neutral)
Adjustable color palette and transparency
Built using classic Directional Movement logic
Works on all markets and all timeframes
Lightweight and efficient (no repainting)
How to Use It
Apply the indicator on your chart and use the background colors to:
Align trades with the market trend
Avoid trading during neutral or low-momentum periods
Confirm trend direction before entries
Improve clarity when using your existing indicators
This indicator does not generate buy/sell signals by itself; instead, it helps visualize the underlying trend environment so traders can make more informed decisions.

Filter Wave1. Indicator Name
Filter Wave
2. One-line Introduction
A visually enhanced trend strength indicator that uses linear regression scoring to render smoothed, color-shifting waves synced to price action.
3. General Overview
Filter Wave+ is a trend analysis tool designed to provide an intuitive and visually dynamic representation of market momentum.
It uses a pairwise comparison algorithm on linear regression values over a lookback period to determine whether price action is consistently moving upward or downward.
The result is a trend score, which is normalized and translated into a color-coded wave that floats above or below the current price. The wave's opacity increases with trend strength, giving a visual cue for confidence in the trend.
The wave itself is not a raw line—it goes through a three-stage smoothing process, producing a natural, flowing curve that is aesthetically aligned with price movement.
This makes it ideal for traders who need a quick visual context before acting on signals from other tools.
While Filter Wave+ does not generate buy/sell signals directly, its secure and efficient design allows it to serve as a high-confidence trend filter in any trading system.
4. Key Advantages
🌊 Smooth, Dynamic Wave Output
3-stage smoothed curves give clean, flowing visual feedback on market conditions.
🎨 Trend Strength Visualized by Color Intensity
Stronger trends appear with more solid coloring, while weak/neutral trends fade visually.
🔍 Quantitative Trend Detection
Linear regression ordering delivers precise, math-based trend scoring for confidence assessment.
📊 Price-Synced Floating Wave
Wave is dynamically positioned based on ATR and price to align naturally with market structure.
🧩 Compatible with Any Strategy
No conflicting signals—Filter Wave+ serves as a directional overlay that enhances clarity.
🔒 Secure Core Logic
Core algorithm is lightweight and secure, with minimal code exposure and strong encapsulation.
📘 Indicator User Guide
📌 Basic Concept
Filter Wave+ calculates trend direction and intensity using linear regression alignment over time.
The resulting wave is rendered as a smoothed curve, colored based on trend direction (green for up, red for down, gray for neutral), and adjusted in transparency to reflect trend strength.
This allows for fast trend interpretation without overwhelming the chart with signals.
⚙️ Settings Explained
Lookback Period: Number of bars used for pairwise regression comparisons (higher = smoother detection)
Range Tolerance (%): Threshold to qualify as an up/down trend (lower = more sensitive)
Regression Source: The price input used in regression calculation (default: close)
Linear Regression Length: The period used for the core regression line
Bull/Bear Color: Customize the color for bullish and bearish waves
📈 Timing Example
Wave color changes to green and becomes more visible (less transparent)
Wave floats above price and aligns with an uptrend
Use as trend confirmation when other signals are present
📉 Timing Example
Wave shifts to red and darkens, floating below the price
Regression direction down; price continues beneath the wave
Acts as bearish confirmation for short trades or risk-off positioning
🧪 Recommended Use Cases
Use as a trend confidence overlay on your existing strategies
Especially useful in swing trading for detecting and confirming dominant market direction
Combine with RSI, MACD, or price action for high-accuracy setups
🔒 Precautions
This is not a signal generator—intended as a trend filter or directional guide
May respond slightly slower in volatile reversals; pair with responsive indicators
Wave position is influenced by ATR and price but does not represent exact entry/exit levels
Parameter optimization is recommended based on asset class and timeframe

W%R Cycle Swings - MTF Trend📄 English Description
Overview
The W%R Cycle Swings – MTF Trend indicator is a market-structure tool built on top of Williams %R cycle logic. It detects meaningful swing highs and lows from W%R behavior, then uses those swings to locate the first Market Structure Shift (MSS-first) and track multi-timeframe trend bias + cancel levels.
This is not a random mashup of indicators: all components are derived from one core concept—W%R cycles—and are combined into a single, coherent framework for reading structure and trend across timeframes.
Core Concepts
1. Williams %R Cycle Swings (Current Timeframe)
Instead of using price swings based only on highs/lows, this script uses Williams %R behavior to define swing points:
Swing High pattern: OS → OB → OS
Swing Low pattern: OB → OS → OB
The script:
Tracks overbought/oversold states using user-defined levels.
Builds a zone for each potential swing (accumulating the extremums during the OB/OS phase).
Confirms a swing only when the opposite state appears again.
Plots labels on the chart:
Swing High label above price
Swing Low label below price
Optional price display on the label (toggle in settings).
This makes the swing points cycle-based rather than purely bar-based.
2. MSS-first (Market Structure Shift on Current TF)
Once swings are defined, the script looks for the first break of the most recent swing:
Bullish MSS-first: price breaks above the last confirmed swing high.
Bearish MSS-first: price breaks below the last confirmed swing low.
You can choose whether to confirm by close or by wick (mssByClose input).
When an MSS-first is detected:
A colored label (bullish/bearish) is drawn at the relevant swing level.
A horizontal line is drawn from the swing bar to the MSS bar to visually connect the structure break.
Internal trendBias is updated to Up or Down, preventing duplicate MSS labels in the same direction.
This gives a clear, visual definition of when the structure actually shifted based on W%R-driven swings.
3. MTF MSS-first Trend & Cancel Logic
The same MSS-first concept is applied inside a function and called via request.security() on multiple timeframes (5m, 15m, 30m, 1h, 4h).
For each timeframe, the function:
Recalculates W%R swings with the same parameters.
Detects MSS-first events (bullish or bearish).
Tracks a trend state:
1 → Up trend
-1 → Down trend
0 → Unknown / Neutral
Maintains a cancel level, which represents the price that would invalidate the current trend:
In an uptrend, cancel is typically the last relevant swing low.
In a downtrend, cancel is typically the last relevant swing high.
This provides:
Trend direction per TF (Up / Down / -)
A concrete price level that acts as a structural “stop” or invalidation level.
4. MTF Trend Table (Visual Overview)
If enabled, a compact table is displayed on the chart (position configurable):
Columns: 5m, 15m, 30m, 1h, 4h
Rows:
Trend → shows Up, Down or -, with color-coded background.
Cancel → shows the current cancel price for that timeframe.
This creates a multi-timeframe structure dashboard that tells you:
Which timeframes are currently in an Up or Down MSS-based trend.
At which price the current structural view would be canceled.
5. Alert Conditions
The script includes alert conditions for:
Current timeframe MSS-first:
Bullish MSS-first (structure break up).
Bearish MSS-first (structure break down).
MTF MSS-first events for:
5m, 15m, 30m, 1h, 4h (Bullish & Bearish separately).
This allows you to receive notifications when a fresh structural shift happens on any of the tracked timeframes.
How to Use
Use Swing High / Swing Low labels to understand the current W%R cycle structure on your main timeframe.
Watch for MSS-first labels to catch the first break of structure after a swing completes.
Use the MTF Trend table:
Trade in the direction of higher-timeframe trends.
Use cancel levels as logical invalidation areas or structural stop guides.
Combine the current timeframe swings with MTF bias:
Example: look for long setups when H1/H4 show Up trend and price forms new bullish MSS on lower TF.
The tool is suitable for both intraday and swing trading, on any symbol and timeframe.
Why This Script Is Original
It links cycle-based swings from Williams %R directly to MSS-first detection, rather than using generic pivot logic.
It combines:
W%R-driven swing definition,
MSS-first structural breaks,
Multi-timeframe trend state,
Cancel (invalidation) levels,
Alerts for MSS events on multiple TFs,
into a single, coherent market-structure framework.
The MTF table is not a generic dashboard: it is specifically built around this W%R-MSS-first structural model, which gives traders both trend context and exact invalidation prices.
🇹🇭 Thai Description — คำอธิบายภาษาไทย
ภาพรวม
อินดิเคเตอร์ W%R Cycle Swings – MTF Trend เป็นเครื่องมืออ่านโครงสร้างราคา โดยใช้ “วงจรของ Williams %R” เป็นหลักในการหา Swing High / Swing Low แล้วใช้จุด Swing เหล่านั้นมาหา MSS-first (จุดเปลี่ยนโครงสร้างครั้งแรก) จากนั้นต่อยอดไปสู่ การดูแนวโน้มหลายกรอบเวลา + ระดับ Cancel (จุดที่โครงสร้างจะถูกมองว่าพัง)
แนวคิดหลัก
Swing จาก Williams %R (TF ปัจจุบัน)
ใช้รูปแบบ OS → OB → OS เพื่อยืนยัน Swing High
และ OB → OS → OB เพื่อยืนยัน Swing Low
เมื่อยืนยันแล้วจะสร้าง Label “Swing High / Swing Low” บนกราฟ และสามารถแสดงราคาบนป้ายได้
ทำให้จุด Swing มีพื้นฐานจาก “Cycle ของ W%R” ไม่ใช่แค่ high/low เฉย ๆ
MSS-first บน TF ปัจจุบัน
ถ้าราคาทะลุ Swing High ล่าสุด → มองเป็น Bullish MSS-first
ถ้าราคาทะลุ Swing Low ล่าสุด → มองเป็น Bearish MSS-first
เลือกได้ว่าจะยืนยันจาก Close หรือจาก ไส้แท่งเทียน
วาดป้าย MSS + เส้นเชื่อมจาก Swing ไปยังจุดที่เกิด MSS
มีตัวแปร trendBias ป้องกันไม่ให้ยิง MSS ซ้ำในทิศทางเดิมจนรก
MTF MSS-first + Cancel Logic
นำ Logic เดียวกันไปใช้กับ TF: 5m, 15m, 30m, 1h, 4h
สำหรับแต่ละ TF จะได้:
สถานะแนวโน้ม: Up / Down / Unknown
ระดับ Cancel: ราคาที่ถ้าหลุดจะถือว่าโครงสร้างเทรนด์นั้นถูก “ยกเลิก”
เช่น ในเทรนด์ขาขึ้น ระดับ Cancel มักมาจาก Swing Low ล่าสุด ฯลฯ
MTF Table บนกราฟ
แสดง Trend + Cancel ของ 5 TF ในรูปแบบตาราง
อ่านง่าย: แถว Trend เป็น Up/Down พร้อมสีพื้น, แถว Cancel เป็นตัวเลขราคา
ใช้ดูภาพรวมโครงสร้างหลาย TF ในมุมมองเดียว
Alert Conditions
แจ้งเตือน MSS-first ของ TF ปัจจุบัน
แจ้งเตือน MSS-first ของ TF 5m / 15m / 30m / 1h / 4h แยก Bull / Bear
วิธีใช้งาน
ใช้ Swing High / Swing Low เพื่อดูว่าโครงสร้าง cycle ปัจจุบันอยู่ตรงไหน
รอให้เกิด MSS-first เพื่อมองว่า “โครงสร้างราคาเริ่มกลับตัวแล้ว”
ใช้ Table MTF:
ดูว่า TF ไหนเป็น Up / Down
ใช้ราคาบรรทัด Cancel เป็นแนว “จุดตัดขาดทุนเชิงโครงสร้าง” หรือจุดเปลี่ยนมุมมอง
เทรดตามทิศทาง TF ใหญ่ แล้วหา Entry จาก MSS ของ TF เล็ก
จุดเด่น / ความเป็น Original
ใช้ Williams %R เป็นฐานในการสร้าง Swing Pattern แทนการใช้ Pivot ธรรมดา
เชื่อม W%R Swing เข้ากับแนวคิด MSS-first อย่างเป็นระบบ
มีทั้ง:
ป้าย Swing
ป้าย MSS + เส้นเชื่อม
MTF Trend + Cancel
Alert เตือน MSS ในหลาย TF
อยู่ในสคริปต์เดียว
เหมาะกับคนที่ต้องการอ่านโครงสร้างราคาแบบมีที่มาที่ไป ไม่ใช่แค่ตามอินดี้ตัวเดียวครับ ✅

Enhanced Multi-Indicator StrategyEnhanced Multi-Indicator Strategy v7 is a trend-following confirmation tool that combines several classic indicators into one clear “voting system.”
Instead of relying on a single signal, this script counts how many indicators agree on a bullish or bearish bias and only fires when the majority lines up and the trend is strong.
It’s designed to help you:
Filter out low-quality signals
Avoid trading against the dominant trend
Get clean, one-time BUY/SELL markers instead of noisy spam signals
How it Works
The indicator evaluates up to 10 components on each bar:
Trend & Structure
Moving Average (MA 50)
EMA Fast (20) vs EMA Slow (50)
Momentum
RSI (14)
MACD (12/26/9)
KDJ
Volatility & Price Location
Bollinger Bands (20, 2)
VWAP
Volume
Volume vs Volume MA (20)
Trend Strength & Direction
ADX + DMI (trend strength and up/down direction)
Optional
Ichimoku Cloud (price vs Senkou A/B)
Each indicator votes bullish or bearish.
The script then:
Counts how many are bullish → bullish_count
Counts how many are bearish → bearish_count
Requires at least Min Indicators for Entry (user-defined) to agree in one direction
Requires ADX above a threshold (default 20) to confirm trend strength
(Optionally) forces entries to follow the DMI trend:
Longs only in uptrends
Shorts only in downtrends
Only when these conditions are met does the script consider a valid long zone or short zone.
Signals: 1x Fire + Cooldown
To keep the chart clean and prevent over-trading:
A BUY arrow is plotted only on the first bar when price enters a new bullish zone.
A SELL arrow is plotted only on the first bar when price enters a new bearish zone.
A cooldown (in bars) can be configured separately for BUY and SELL so the script will not fire again in the same direction too frequently.
Background colors (optional):
Green background = bullish zone (majority indicators bullish + strong trend)
Red background = bearish zone (majority indicators bearish + strong trend)
This makes it easy to see when the “environment” is favorable for longs or shorts, while the arrows highlight the first opportunity in each zone.
Inputs & Tuning
Key inputs:
Min Indicators for Entry – how many indicators must agree (e.g. 5–7 for stricter filtering)
Strict Trend Filter – if enabled, entries must follow DMI trend (recommended for trend-following)
Cooldown BUY / SELL – minimum number of bars before a new signal in the same direction
Toggles to enable/disable each component (MA, EMA, RSI, MACD, KDJ, BB, Volume, VWAP, ADX, Ichimoku)
General ideas:
Increase Min Indicators for Entry and/or cooldown to reduce the number of signals and focus on stronger trends.
Lower values will make the indicator more active, suitable for shorter-term trading or scalping.
Important Note
This is an indicator, not a full trading system:
It does not manage entries/exits, position sizing, or risk by itself.
Always combine it with your own risk management, stop-loss / take-profit rules, and higher-timeframe context.
Use it as a confirmation / regime tool:
Trade only in the direction of the active zone,
Take BUY signals during bullish regimes,
Take SELL signals during bearish regimes.

Trend Pulse Algo (LTM)Trend Pulse Algo LTM Indicator Description
Overview
Trend Pulse Algo LTM is an advanced multi layer technical indicator designed for TradingView that combines moving average MA crossovers confirmation signals pivot based structure analysis imbalance zone detection and overextension warnings to identify potential trend shifts continuations and reversal points. It aims to provide traders with reliable entry and exit signals in trending markets while highlighting areas of market inefficiency imbalances and overextended price moves that could signal exhaustion.
This indicator operates on a pulse concept where it detects rhythmic shifts in market momentum through layered MAs a quick MA for short term sensitivity a mid MA for intermediate confirmation and a long MA as a baseline trend filter. Signals are generated based on alignments and crosses between these MAs but with added layers of confirmation to reduce false positives such as requiring consecutive bars above below the long MA and breaks of prior pivot highs lows. It incorporates higher timeframe HTF analysis for imbalance zones to capture broader market context making it suitable for swing trading trend following or scalping on lower timeframes when combined with the overextension detector.
Unlike simple MA crossover systems for example standard dual EMA strategies this algo uses adaptive MA types based on timeframe pivot deviation for structural breaks and a tally based confirmation to filter noise. Imbalance zones identify fair value gaps or inefficiencies between candle bodies and wicks where price may retrace to fill. Overextension is calculated relative to the mid MA using a rolling mean absolute deviation MAD ratio highlighting potential tops bottoms in strong trends. The result is a visually clean or detailed based on mode overlay that colors bars backgrounds plots labels for signals and pivots and draws zones to guide decision making.
How It Works
MA Layers and Signal Generation
Three MAs quick mid long are computed using either SMA or EMA selected dynamically based on the charts timeframe for optimal responsiveness for example EMA on lower TFs for faster signals.
Early Signals A crossover of the quick MA above the mid MA while above the long MA triggers a Possible Bull label indicating early momentum shifts. A crossunder below triggers Possible Bear.
Confirmed Signals Bullish confirmation requires a set number of bars closing above the long MA plus alignment quick greater than mid and a break above the prior pivot high. Bearish requires bars below the long MA and a break below the prior pivot low. This uses a counter mechanism to ensure persistence reducing whipsaws. Breaks are detected via crossovers under of close versus prior highs lows.
State persistence tracks the current regime bull bear warn early coloring the chart accordingly until a new signal overrides it.
Pivot Detection and Structure
Pivots are identified by scanning for highs lows separated by a minimum bar depth with a percentage deviation threshold to confirm validity. This follows a zigzag like approach but with deviation filtering for robustness.
Labels like HH Higher High HL Higher Low LH Lower High LL Lower Low highlight market structure helping identify trends for example HH HL for uptrends or breakdowns. These are used internally to validate signal breaks.
Imbalance Zones
Zones detect imbalances or gaps between candle bodies and prior highs lows where unfilled inefficiencies attract price.
For bullish zones If open greater than close and high minus low two less than zero a zone is drawn from calculated top bottom limits. Bearish similarly for close greater than open.
Supports current TF HTF or both. Zones extend rightward until filled price touches the opposite side or mid line if enabled then either delete or shorten based on settings. Mid lines can act as fill triggers for partial closures.
HTF data is fetched via security for broader context resetting on new HTF bars.
Overextension Indicator
Measures price deviation from the mid MA relative to a rolling average RMA of relative deviations over a length.
Multipliers define tiers mild for example two times avg deviation moderate three times extreme four times. Circles plot above below bars in bull bear states when thresholds are exceeded signaling potential reversals for example red for extreme tops in uptrends. This is akin to a Bollinger Band squeeze expansion but normalized to MA distance for trend specific warnings.
Chart Coloring and Visuals
Background or candle coloring reflects the state green for bull red for bear orange for warn blue for early.
Modes control clutter Clean hides MAs zones pivots Balanced shows essentials Detailed includes all.
How to Use It
Setup Add to your chart via TradingViews indicator search. Adjust inputs based on asset timeframe for example shorter MA periods for volatile cryptos longer for stocks.
Trading Strategy Ideas
Trend Following Enter long on Confirmed Bull labels exit on Confirmed Bear or extreme overextension circles. Use imbalance zones as support resistance for stops targets for example buy dips to unfilled bullish zones.
Reversal Scalping Watch for Possible Bull Bear near pivot labels for example HL LL and overextension in the opposite direction. Confirm with zone fills.
Multi TF Analysis Set HTF to D for daily context on hourly charts zones from HTF often act as magnets.
Risk Management Place stops below prior lows in bulls or above highs in bears. Target zone edges or MA crosses. Avoid trading against strong states without confirmation.
Alerts Set up via TradingView for Early Up Down or Up Down Confirm to notify on signal edges.
Limitations Best in trending markets may lag in ranges. Test on historical data no indicator is foolproof combine with volume price action.
Detailed Input Settings
Below is a comprehensive breakdown of all user adjustable inputs from the settings panel grouped as in the script. Each explains what it controls its effect on the indicators logic and usage tips. Defaults are provided for reference.
Chart Mode
Chart Mode default Detailed Mode options Clean Mode Balanced Mode Detailed Mode
Controls visual detail level. Clean Mode hides MAs imbalance zones and pivots for a minimal overlay focused on signals and coloring. Balanced Mode shows MAs and signals but omits zones pivots. Detailed Mode displays everything for in depth analysis. Use Clean for live trading to reduce clutter Detailed for backtesting structure review.
Display Settings
Color Style default Candles options Background Candles
Determines how states bull bear warn early are visualized. Background colors the chart area for example green shading for bull. Candles colors bar bodies wicks directly. Background is subtler for multi indicator setups Candles emphasizes signals on naked charts.
Imbalance Zone HTF Config
Higher TF Period default D
Sets the higher timeframe for imbalance detection for example D for daily four H for four hour. This fetches broader data to identify significant zones. Use a TF four to five times your current for context for example daily on one H charts avoid very high TFs like W on intraday for relevance.
TF Mode default Current TF options Current TF Current plus HTF HTF Only
Defines timeframe handling for zones. Current TF uses only your charts TF. Current plus HTF combines both for layered zones. HTF Only ignores current TF. Current plus HTF is ideal for multi TF confluence HTF Only simplifies for swing traders.
Shift default ten min zero max five hundred
Horizontal offset in bars for current TF zone labels. Higher values shift labels rightward to avoid overlap. Adjust if labels crowd the chart.
HTF Shift default twenty min zero max five hundred
Similar to Shift but for HTF zone labels. Use larger offsets for HTF to distinguish them visually.
Imbalance Zone Core Options
Mid Line Fill default false
Enables a midpoint line in each zone zones fill close short when price touches this mid line instead of the far edge. Activates partial fill logic for more conservative zone closure. Enable for tighter risk in volatile markets.
Remove Filled Zones default true
If true completely deletes filled zones if false shortens them to the fill point keeping history. True clears clutter false retains context for review.
Display TF on Zone default false
Shows the timeframe for example D IZ on zone labels. Useful for distinguishing current versus HTF zones in combined mode.
Max Upward Zones default twenty min one max fifty
Limits displayed bullish upward zones removes oldest when exceeded. Lower for cleaner charts higher for historical depth.
Max Downward Zones default twenty min one max fifty
Same as above but for bearish downward zones.
Imbalance Zone Visuals
Upward Zone color green at ninety percent transparency
Color for current TF upward imbalance zones. Adjust opacity for visibility.
HTF Upward Zone color lime at eighty percent transparency
Color for higher timeframe upward imbalance zones. Differentiate from current for example lighter shade.
Downward Zone color red at ninety percent transparency
Color for current TF downward imbalance zones.
HTF Downward Zone color maroon at eighty percent transparency
Color for higher timeframe downward imbalance zones.
Mid Line Color color white at eighty five percent transparency
Color for the optional midpoint line in zones.
Text Color color white
Color for text labels on zones.
MA Layers
Quick MA Period default ten min one
Length for the fastest moving average sensitive to short term price. Shorter for example five for scalping longer for example fifteen for less noise.
Mid MA Period default twenty min one
Intermediate MA length used for crossovers and overextension base. Typically two times quick for balance.
Long MA Period default fifty min one
Baseline trend filter length. Longer for example one hundred for major trends shorter for active trading.
MA Variants by Period
Under one H default EMA options SMA EMA
MA type for timeframes under one hour for example EMA for faster response.
One H to less than five H default EMA options SMA EMA
MA type for one to five hour timeframes.
Five H to less than one D default EMA options SMA EMA
MA type for five hour to one day timeframes.
One D plus default EMA options SMA EMA
MA type for daily and higher timeframes. Adapt to market EMA for trends SMA for mean reversion.
Signal Confirmation
Bull Confirm Bars default one min zero
Consecutive bars needed above long MA for bull confirmation. Zero for instant higher for example three filters noise but delays entries.
Bear Confirm Bars default two min zero
Same for bear below long MA. Asymmetrical default higher for bears assumes uptrend bias.
Pivot Detection
Pivot Depth default six min one
Min bars between pivots. Higher reduces minor swings lower captures more structure.
Pivot Deviation percent default one point zero min zero point one
Percent change required for new pivot. Higher ignores small moves for example two percent for stocks zero point five percent for forex.
Display HH and HL default true
Shows labels for Higher Highs Lows bullish structure.
Display LH and LL default true
Shows labels for Lower Highs Lows bearish structure.
Overextension Indicator
Show Overextension Circles Potential Tops default true
Enables circles above bars in bull states for potential tops.
Show Overextension Circles Potential Bottoms default true
Enables below bars in bear states for bottoms.
Overextension Length default fourteen min one
Period for rolling relative deviation average. Matches RSI STOCH defaults for alignment.
Mild Multiplier default two point zero min zero point zero
Threshold for mild overextension yellow circle. Zero disables tier.
Moderate Multiplier default three point zero min zero point zero
For moderate orange.
Extreme Multiplier default four point zero min zero point zero
For extreme red. Tune lower for sensitive warnings in ranging markets.

BK AK-13⚔️ BK AK-13 — The Mentor’s 13. Revealed on 11. Command the Band. Punish the Extremes. ⚔️
This is my 11th release—and that matters. 11 is a sacred number to me, so for release eleven I’m doing something I never planned to do: I’m putting my mentor’s secret 13 MA into the open.
For years, this 13-based MA framework was part of our private playbook—quietly doing work behind the scenes. Now I’m handing it to you fully armed, because I believe in karma in, karma out: I took years of wisdom from the market. I took years of wisdom from the men who taught me. This is one of the ways I give back—with structure, respect, and intent.
🎖 Full Credit — Respect the Origin
The core architecture of BK AK-13 is not mine. It stands firmly on the work of DZIV.
What comes from DZIV:
The Heikin Ashi MA engine (MA calculated on HA Open/High/Low/Close)
The multi-MA engine on the HA feed (ALMA / HMA / SMA / RMA / VWMA / WMA / ZLEMA / EMA)
The Body / Wick / Band zone classification for price
The dynamic body & wick clouds that give this structure its clean visual form
If this framework changes the way you see trend and price location, remember the name: DZIV.
On top of his backbone, I forged the BK AK-13 enhancement layer: trend-strength regimes, background modes, structured band-reversal arrows, momentum acceleration dots, extreme pivot markers, historical band-touch rails, the info panel, and a complete alert suite.
And as always, the “AK” in the name is not branding—it’s honor. It belongs to my mentor A.K. His secret 13 MA is the spine of this system, and his obsession with clarity, patience, and zero shortcuts sits behind every decision in this tool. Above that, all glory and gratitude to Gd—the real source of any wisdom, edge, or endurance we have in this game.
🧠 Why “BK AK-13”?
BK — my mark, the house I’m building.
AK — my mentor, the standard I’m still chasing.
13 — his secret moving average, the length that quietly shaped how I see trend, location, and pressure.
For years, 13 stayed off the public record—used, not discussed. Now, on indicator number 11, I’m putting that weapon in the open: 11th release. Sacred number. Secret 13 revealed, not for hype—but as karmic give-back. Karma in. Karma out.
🧱 What BK AK-13 Actually Is
BK AK-13 is a Heikin Ashi MA battle band with a brain and a conscience.
It does three big things:
Builds a smoothed HA-MA band using Heikin Ashi OHLC to create a cleaner, truer band around price.
Maps price into zones: Body, Upper Wick, Lower Wick, Above Band, Below Band—so every bar has a role.
Assigns a trend regime by computing a normalized trend-strength %, classifying the environment as Weak / Normal / Strong / Extreme.
You’re never guessing: Is this real trend or just drift? Am I in the spine, the wick, or off the rails? Is this where I press, fade, or stand down? The band, zones, and regimes answer that for you.
🎨 Visual Architecture — Band, Clouds, Regimes
Body & Wick Clouds (DZIV’s craft)
Body cloud between HA-MA Open & Close.
Wick clouds between body and HA-MA High/Low.
Color follows trend: bull, bear, or neutral.
You’re not decoding noisy candles—you’re reading the spine and skin of the move.
Background Regime Modes (BK layer)
Standard – background always on, soft trend-follow color.
Hybrid (Extreme + Breaks) – lights only on extreme trend states or reversal break events.
Hybrid (Strong/Extreme + Breaks) – shows strong & extreme regimes, darker tone on true extremes.
Breaks Only – background flashes only on reversal arrows.
When the background goes quiet, you’re in ordinary flow. When it lights up, something is strategic, not cosmetic.
🎯 Weapons Inside BK AK-13
⭐ Trend Change Stars
Stars appear when the internal band trend crosses zero: bull star when it flips negative → positive, bear star from positive → negative. They’re your pivot flags for swing shifts when aligned with your higher timeframe bias.
🔁 Band Reversal Arrows — Edge Flip Logic
Not every band tap—only structured reversals:
Reversal Down (short idea): first a break of the upper band, then later, for the first time, a break of the lower band.
Reversal Up (long idea): first a break of the lower band, then later, for the first time, a break of the upper band.
You can require a close outside the band and set a minimum break distance (% of band range) so only real punches count. These arrows mark campaign flips, not noise.
💡 Momentum Acceleration Dots
In strong trend regimes only:
Green dot = trend accelerating in its own direction (uptrend steepening, downtrend deepening).
Red dot = trend decelerating, even if direction hasn’t flipped yet.
They protect you from chasing late when the engine is dying and from staying stubborn when momentum is bleeding out.
⚠ Extreme Pivot Markers
Pivot highs/lows are found with a configurable lookback and only marked when trend strength at that pivot bar is above your threshold. You’ll see ⚠ above likely exhaustion tops in strong bulls and ⚠ below likely exhaustion lows in strong bears—perfect for final scale-outs, countertrend scouts, and knowing where campaigns commonly run out of blood.
📏 Historical Band-Touch Rails
Over your lookback window, BK AK-13 tracks the highest upper band touch and lowest lower band touch, drawing them as dashed rails. They’re dynamic SR built from real band extremes—ideal for trend targets, fade zones, and stop/scale-out context.
🧭 Info Panel — On-Chart War Room
The Info Panel compresses everything into a single strip: direction + strength codes (BULL STR, BEAR EXT, NEUT WEAK), four segments that brighten as |trend| climbs from weak → normal → strong → extreme, and a zone + deviation label (BDY/UW/LW/AB/BL × OK/AL/EX).
Hover and you get a full tactical brief: trend, momentum change, acceleration, band levels, distances to upper/lower/nearest band in ticks, outer-band streaks, strategic state, plus “Action” guidance and a “What-if” forward scenario. It doesn’t just tell you where you are—it pushes you toward a structured thought process on each bar.
🕹 How to Use BK AK-13 with Intent
1️⃣ Trend-Rider Mode
In Strong/Extreme bull with price in Body or Lower Wick: buy dips into the band (mid/lower) instead of chasing tops; target the upper band / upper rail while structure holds.
In Strong/Extreme bear with price in Body or Upper Wick: sell rallies into the band; target lower band / lower rail while acceleration stays healthy.
The band defines where you’re allowed to do business.
2️⃣ Extreme Snapback Hunter
Prime conditions: trend tagged Extreme, price pressed into the outer band in trend direction, strategic state lit + Hybrid background active. That’s where pressing fresh risk often flips from reward to punishment. Use it to stop adding, start harvesting, or launch controlled mean-reversion probes back to the midline—if your system and risk rules allow it.
3️⃣ Exhaustion & Turn Zones
Watch for confluence: red momentum dots, extreme pivot ⚠ markers, a reversal arrow, and a nearby historical rail or your own key level (Fibs, VWAP, volume structure, etc.). That’s where campaigns often end, traps are set, and new campaigns begin.
🔔 Alerts — The Chart Calls You
Included alerts: Bullish/Bearish Trend Change, Strategic Extreme at Outer Band, Reversal Up/Down, Extreme Pivot High/Low, and Body Zone Entry during Strong Trend. Use them so you respond to events, not impulses.
🔧 Tuning the Extremes — Help Me Perfect the Advanced Side
The extreme thresholds and advanced features are powerful but sensitive, and there is no single perfect universal setting. I’m still tuning them myself across instruments and timeframes: strong/extreme trend thresholds, extreme background thresholds, momentum acceleration threshold, pivot lookback + pivot trend filter, band-touch lookback, and minimum break distance for reversals.
Different markets and timeframes breathe differently.
If you find killer settings for a specific symbol + timeframe, please share:
Instrument & timeframe
Your tuned values for extremes and advanced modules
A few charts showing why they work
Experiment. Dial it in. Then share your best settings for the extremes and advanced features. Let this become a crowd-forged battle manual: I gave you the engine, you tune it to your battleground, and we all benefit from what’s discovered in live fire. Karma in. Karma out.
🤝 Pay It Forward
If BK AK-13 sharpens your read, don’t just flex screenshots—teach structure. Show newer traders body vs wick vs edge. Talk about when you didn’t take a trade because the band said “danger,” not just the wins. Share your settings, charts, and lessons—especially around the extremes and advanced modules. I’m sharing a mentor’s secret on release 11 for a reason. If it blesses you, don’t let it stop with you.
📜 King Solomon’s Lens
King Solomon said: “The prudent sees danger and hides himself, but the simple go on and suffer for it.”
BK AK-13 is built exactly around that dividing line: the simple chase candles at the outer band in extreme regimes and get punished; the prudent see danger in the structure, hide their size, hedge, or reverse with intent.
This indicator won’t make you prudent. It just removes your excuse for being simple.
⚔️ BK AK-13 — The mentor’s secret 13, revealed on 11. Let the band define the field. Let wisdom define your strike.
May Gd bless your eyes, your patience, your settings, and every decision you make at the edge. 🙏

Latest Up/Down StreakThis indicator allows following the latest streak of ups and downs according to clos price. It is made as a tool for investors wanting to time their buy/sell according to streaks.
The indicator allows for creating alerts to notify when a certain streak has reached.

Weis Wave Volume MTF 🎯 Indicator Name
Weis Wave Volume (Multi‑Timeframe) — adapted from the original “Weis Wave Volume by LazyBear.”
This version adds multi‑timeframe (MTF) readings, configurable colors, font size, and screen position for clear dashboard‑style display.
🧠 Concept Background — What is Weis Wave Volume (WWV)?
The Weis Wave Volume indicator originates from Wyckoff and David Weis’ techniques.
Its purpose is to link price movement “waves” with the amount of traded volume to reveal how strong or weak each wave is.
Instead of showing bars one by one, WWV accumulates the total volume while price keeps moving in the same direction.
When price direction changes (up → down or down → up), it:
Finishes the previous wave volume total.
Starts a new wave and begins accumulating again.
Those wave volumes help traders see:
Effort vs Result: Big volume with small price move ⇒ absorption; low volume with big move ⇒ weak participation.
Trend confirmation or exhaustion: High volume waves in trend direction strengthen it, while low‑volume waves hint exhaustion.
⚙️ How this Script Works
Trend & Wave Detection
Compares close with the previous bar to determine up or down movement (mov).
Detects trend reversals (when mov direction changes).
Builds “waves,” each representing a continuous run of bars in one direction.
Volume Accumulation
While price keeps the same direction, the script adds each bar’s volume to the running total (vol).
When direction flips, it resets that total and starts a new wave.
Multi‑Timeframe Computation
Calculates these wave volumes on three timeframes at once, chosen dynamically:
Active Chart Timeframe Displays WWV for:
1 min 1 min
5 min 5 min
15 min 15 min
Any other Chart TF
It uses request.security() to pull each timeframe’s latest WWV value and current wave direction.
Visual Output
Instead of plotting histogram bars, it shows a table with three numeric values:
WWV (1): 25.3 M | (15): 312 M | (240): 2.46 B
Each value is color‑coded:
user‑selected Uptrend Color when price wave = up
user‑selected Downtrend Color when wave = down
You can position this small table in any corner/center (top / bottom × left / center / right).
Font size is user‑adjustable (Tiny → Huge).
📈 How Traders Use It
Quickly gauge buying vs selling effort across multiple horizons.
Compare short‑term wave volume to higher‑timeframe waves to spot:
Alignment → all up and big volumes = strong trend
Divergence → small or opposite‑colored higher‑TF wave = potential reversal or pause
Combine with Wyckoff, VSA, or standard trend analysis to judge if a breakout or pullback has real participation.
🧩 Key Features of This Version
Feature Description
Multi‑Timeframe Panel Displays WWV values for 3 selected TFs at once
Dynamic TF Mapping Auto‑adjusts which TFs to use based on chart
Up/Down Color Coding Customizable colors for wave direction
Adjustable Font and Placement Set font size (Tiny→Huge) and screen corner/center
No Histograms Keeps chart clean; acts as a compact WWV dashboard

Lynie's V9 SELL🟢🔴 Lynie’s V8 — BUY & SELL (Mirrored, Interlocking System)
Lynie’s V8 is a paired long/short engine built as two mirrored scripts—Lynie’s V8 BUY and Lynie’s V8 SELL—that read price the same way, flip conditions symmetrically, and manage trades with the exact logic on opposite sides. Use either one standalone or run both together for full two-sided automation of entries, re-entries, caution states, and adaptive SL/TP.
✳️ What “mirrored” means here
Supertrend Tri-Stack (10/11/12):
BUY: ST10 primary pierce; ST12 fallback; “PAG Buy” when price pierces any ST while above the other two.
SELL: Exact inverse—ST10 primary pierce down; ST12 fallback; “PAG Sell” when price pierces any ST while below the other two.
Re-Enter Clusters:
BUY: Ratcheted up (Heikin-Ashi green holds/tightens).
SELL: Ratcheted down (Heikin-Ashi red holds/tightens).
Both sides use the same cluster age/decay math, care penalties, session awareness, and fast-candle tightening.
Care Flags (context risk):
Ichimoku, MACD, RSI combine into single and paired flags that tighten or widen offsets on both sides with the same scoring.
VWAP–EMA50 (5m) cluster gate:
Identical distance checks for BUY/SELL. When the mean cluster is present, offsets and labels adapt (tighter/“riskier scalp” messaging).
Golden Pocket A/B/C (prev-day):
Same fib boxes & labeling (gold tone) on both sides to call out TP-friendly zones.
SL/TP Envelope:
Shared dynamic engine: per-bar decay, fast-candle expansion, and care-based compress/relax—all mirrored for up/down.
Caution Labels:
BUY side prints CAUTION SELL if HA flips red inside an active long cluster.
SELL side prints CAUTION BUY if HA flips green inside an active short cluster.
Same latching & auto-release behavior.
🧠 Core workflow (both sides)
Primary trigger via ST10 pierce (structure shift) with an ST12 fallback when ST10 didn’t qualify.
PAG Mode when price is already on the right side of the other two STs—strongest conviction.
Cluster phase begins after a signal: ratcheted re-entry level, session-aware offsets, dynamic tightening on fast bars.
Care system shapes every re-entry & SL/TP label (Ichi/MACD/RSI combos + VWAP/EMA gate + QQE).
Protective layer: SL-wick and SL-body logic, caution flips, and “hold 1 bar” cluster carry after SL to avoid whipsaw spam.
🔎 Labels & messages (shared vocabulary)
Lynie’s / Lynie’s+ / Lynie’s++ — strength tiers (ST12 involvement & clean context).
Re-Enter / Excellent Re-Enter — cluster pullback quality; ratchet shows the “must-hold” zone.
SL&TP (n) — live offset multiplier the engine is using right now.
CAUTION BUY / CAUTION SELL — HA flip against the active side inside the cluster.
Restart Next Candle — visual cue to re-arm after a confirmed signal bar.
⚡ Why run both together
Continuity: When a long cycle ends (SL or caution degradation), the SELL engine is already tracking the inverse without re-tuning.
Symmetry: Same math, same signals, opposite direction—no hidden biases.
Coverage: Trend hand-offs are cleaner; you don’t miss early shorts after a long fade (and vice versa).
🔧 Recommended usage
Intraday futures (ES/NQ) or any liquid market.
Keep the VWAP–EMA cluster ON; it filters FOMO chases.
Honor Caution flips inside cluster—scale down or wait for the next clean re-enter.
Treat Golden Zones as TP magnets, not guaranteed reversals.
📌 Notes
Both scripts are Pine v6 and independent. Load BUY and SELL together for the full experience.
All offsets (re-enter & SL/TP) are visible in labels—so you always know why a zone is where it is.
Alerts are provided for signals, re-enter hits, caution, and SL events on both sides.
Summary: Lynie’s V8 BUY & SELL are vice-versa twins—one framework, two directions—delivering consistent entries, adaptive re-entries, and contextual risk management whether the market is pressing up or breaking down.

Directional Flow Index (DFI) — v2.4Directional Flow Index (DFI) — v2.4
✨ 1) What DFI measures (conceptual)
DFI aims to quantify directional flow —i.e., whether trading activity is skewed toward buying (supportive pressure) or selling (resistive pressure) —and then present it as a normalized oscillator that is easy to compare across symbols and timeframes. It is designed to highlight high-confidence thrusts within a prevailing trend and to detect fatigue as momentum decays.
Positive DFI (> 0) : net buy-side pressure dominates.
Negative DFI (< 0) : net sell-side pressure dominates.
Magnitude reflects intensity after de-trending and Z-score normalization.
While multiple “flow” proxies exist, this version emphasizes a True Volume Delta (TVD) workflow (default) that tallies buy vs. sell volume from a lower timeframe (LTF) inside an anchor timeframe bar, producing a more realistic per-bar delta when supported by the symbol’s data.
✨ 2) Core pipeline (how it works)
Flow construction (TVD default).
Using ta.requestVolumeDelta(LTF, Anchor), the script approximates up-volume vs. down-volume inside each anchor bar.
A per-bar delta is derived (with a reset on anchor switches to avoid jumps).
If TVD is unsupported on the symbol, DFI can fall back to synthetic proxies (e.g., Synthetic Delta Volume: (close-low)/(high-low) × vol), but TVD is the intended default.
CVD-style accumulation.
Per-bar delta is cumulatively summed into a running flow line (CVD-like), providing temporal context to the net pressure.
High-pass de-trending + smoothing.
A high-pass step (EMA-based) removes slow drifts (trend bias) from the CVD line.
A short EMA smoothing reduces noise while preserving thrust.
Z-score normalization.
The de-trended series is standardized (rolling mean/std), so DFI readings are comparable across markets/timeframes.
The Signal line is an EMA of DFI and is used for momentum cross checks.
SuperTrend (regime filter).
A lightweight SuperTrend (ATR len=5, factor=6 by default) provides up/down regime.
DFI coloring and alerts can be conditioned on the regime (optional).
Fatigue % (0–100).
Tracks energy (EMA of |DFI|) vs. peak energy (with adaptive half-life decay).
When energy stays far below the decaying peak, Fatigue% rises, suggesting momentum exhaustion.
The decay rate adapts to DFI volatility and regime alignment, so decay is faster when thrusts are misaligned with trend, slower when aligned and orderly.
Gradient highlight (confidence shading).
Histogram color transparency blends three ingredients:
DFI strength (|DFI| vs user-set bands)
Low fatigue (fresher thrusts score higher)
Regime alignment (DFI sign vs SuperTrend direction)
Result: darker bars indicate higher confidence in thrust quality; faint bars warn of weaker, stale, or misaligned pushes.
✨ 3) Interpreting the plots
DFI histogram (columns):
Green above zero for buy-side thrust, Red below zero for sell-side thrust.
Opacity encodes confidence (darker = stronger alignment & lower fatigue).
Signal (line): EMA of DFI used for momentum regime checks.
Zero line: structural reference for thrust crossovers.
Fatigue Table (optional): shows Fatigue%, SuperTrend regime, and selected Flow Method.
✨ 4) Alerts (examples)
Long Thrust: DFI crosses above zero while in Up regime.
Short Thrust: DFI crosses below zero while in Down regime.
Loss of Momentum (Up): DFI crosses below Signal while DFI > 0 (warns of weakening long thrust).
Loss of Momentum (Down): DFI crosses above Signal while DFI < 0 (warns of weakening short thrust).
✨ 5) How to set the TVD Lower TF (important)
TVD needs a sensible LTF/Anchor ratio for balanced accuracy and performance. As a rule of thumb, aim for ~30–120 LTF bars inside one anchor bar:
1h chart → 1–2m LTF (if seconds not available).
4h → 3–5m.
1D → 15–30m.
1W → 1–2h.
1M → 4h–1D.
Notes: Some symbols/exchanges do not provide seconds. Too small an LTF can be heavy/noisy; too large becomes coarse/laggy.
✨ 6) Practical usage patterns
Trend-following entries:
Look for DFI > 0 in Up regime (green) with low Fatigue%, and DFI crossing above zero or above its Signal.
Prefer darker (higher-confidence) histogram bars.
Trend-following exits / de-risking:
Rising Fatigue% toward your high threshold (e.g., 80–90) suggests exhaustion.
DFI vs Signal crosses against your position can be used to scale down.
Avoid chop:
When DFI oscillates around zero with faint bars and Fatigue% rises quickly, quality is low—be selective.
✨ 7) Inputs (summary)
Flow Method: default True Volume Delta (LTF scan); synthetic fallbacks available.
Processing: Detrend length, smoothing EMA, Z-score window, Signal EMA.
Regime: SuperTrend ATR length & factor (default 5 & 6).
Fatigue%: EMA length, base half-life, adaptive volatility coupling (enable/disable, sensitivity).
UI Highlight: strength thresholds, fatigue cap, alignment weights, opacity range.
Table: toggle Fatigue table, decimals, position.
✨ 8) Compatibility & performance notes
TVD requires supported data for the symbol; if unavailable, DFI can switch to synthetic deltas.
Smaller LTFs increase request load and may introduce noise; prefer a balanced ratio.
The indicator is designed to be self-contained; no other overlays are needed to read the outputs.
✨ 9) Limitations and good practice
This is an oscillator, not a price predictor. Extreme values can persist in strong trends.
Normalization (Z-score) makes values comparable, but distributions differ across assets/timeframes.
Always combine with risk management and position sizing; avoid interpreting any single condition as a guarantee.
✨ 10) Disclaimer
This script is for educational purposes only and does not constitute financial advice. Trading involves risk, including possible loss of principal.
---------------------------------------------------------------------------------------------------------------------
한국어 번역 / Korean version below
✨DFI란 무엇인가?
DFI는 시장의 매수·매도 우위를 Flow(흐름) 형태로 분석하여
그 에너지를 정규화된 오실레이터로 표현하는 지표입니다.
가격의 단순 변동이 아니라, “얼마나 일관성 있는 압력(Flow)이 유지되는가”를 보여줍니다.
DFI > 0: 매수세 우위 (상방 압력)
DFI < 0: 매도세 우위 (하방 압력)
값의 크기: 모멘텀의 강도 (Z-score 기반 정규화)
기본 방식인 True Volume Delta (TVD) 는 상위 봉(Anchor) 내부의 하위 타임프레임(LTF) 데이터를 스캔해
실제 매수/매도 체결량 차이를 계산합니다.
이로써 단순 가격 변화가 아닌 실제 체결 흐름의 방향성을 반영합니다.
✨DFI의 계산 과정 (개념적 흐름)
1. Flow 계산 (TVD 또는 대체 방식)
ta.requestVolumeDelta()를 사용하여 상·하위 TF간 볼륨 델타를 계산합니다.
TVD 미지원 심볼은 자동으로 Synthetic Delta Volume 등 대체 방식으로 전환됩니다.
2. 누적(CVD) 구성
Flow를 CVD처럼 누적하여 순매수/순매도 압력을 누적 추적합니다.
3. 고역통과(High-pass) 필터
누적 흐름(CVD)에서 장기 추세 성분을 제거하여 순수한 변동 에너지만 남깁니다.
4. Z-score 정규화
평균과 표준편차로 표준화해 DFI의 크기를 **일정한 스케일(0 중심)**로 만듭니다.
다른 종목·시간대 간 비교가 용이합니다.
5. SuperTrend 레짐(추세 상태) 인식
ATR 기반 ST(기본: Length=5, Factor=6)를 통해 시장이 상승/하락/중립 중 어디에 있는지를 감지합니다.
DFI 컬럼 색상 및 알림은 이 ST 방향에 따라 동작합니다
6. Fatigue% (피로도 지수)
최근 에너지 평균과 역사적 피크(감쇠)를 비교해 0~100%로 “신선도”를 표현합니다.
높을수록 피로한 상태, 낮을수록 신선한 추세.
또한 변동성과 정렬 여부에 따라 Adaptive Half-Life로 감쇠 속도가 자동 조정됩니다.
7. 그라디언트 하이라이트 (Gradient Highlight)
DFI 강도(|DFI|), Fatigue%, 레짐 정렬 상태를 종합해 히스토그램의 투명도를 연속적으로 변화시킵니다.
강하고 신선하며 정렬된 추세일수록 더 진하게 표시, 반대로 약하거나 피로한 구간은 흐리게 표시됩니다.
✨DFI 차트 해석법
DFI 히스토그램 (컬럼):
위로 향한 초록색 = 매수 우위,
아래로 향한 빨강색 = 매도 우위.
진할수록 “신뢰도 높은 흐름(Aligned + Low Fatigue)”
흐릴수록 “노이즈성 움직임 / 피로 구간”
Signal 선:
DFI의 EMA.
DFI와의 교차는 모멘텀 전환 신호로 사용.
Zero 선:
추세 전환의 기준선.
Fatigue Table:
Fatigue%, Regime, Flow Method 정보를 실시간 표시.
✨알림 조건 (Alerts)
DFI Long Thrust: 상승 레짐에서 DFI가 0 위로 돌파.
DFI Short Thrust: 하락 레짐에서 DFI가 0 아래로 돌파.
Loss of Momentum (Up): DFI>0 상태에서 Signal 아래로 하락.
Loss of Momentum (Down): DFI<0 상태에서 Signal 위로 상승.
TVD (True Volume Delta) 설정 가이드
TVD는 Anchor:LowerTF = 약 30~120배 비율이 가장 효율적입니다.
1시간봉 -> 30초~2분
4시간봉 -> 2~8분
일봉(1D) -> 12~48분
주봉(1W) -> 1~4시간
월봉(1M) -> 4시간~ 1일
참고:
일부 거래소는 초 단위를 지원하지 않습니다 → 분 단위로 대체.
너무 짧은 LTF → 과부하/노이즈,
너무 긴 LTF → 신호 지연/정밀도 저하.
✨활용 전략 예시
추세 추종 (Trend-following):
Up Regime에서 DFI>0 & Fatigue% 낮을 때 롱 신호 우선.
DFI가 Signal 위로 돌파하는 시점이 thrust 시작점.
리스크 축소 (De-risking):
Fatigue%가 80~90 이상이면 추세 과열로 간주.
DFI가 Signal을 역방향으로 교차 시 포지션 축소 고려.
횡보 회피:
DFI가 0선 부근에서 얕게 진동하며 흐릿하게 표시될 때는
방향성이 약한 구간 → 진입 회피.
✨한계 및 권장 사용법
TVD는 심볼/거래소의 지원 여부에 따라 제한될 수 있습니다.
Z-score 정규화로 수치 간 비교는 용이하지만, 자산마다 분포 특성이 달라 절대값 해석은 주의 필요.
Fatigue%는 “모멘텀 신선도” 개념이지, 반전 타이밍이 아닙니다.
리스크 관리 및 전략적 컨텍스트 안에서 사용하세요.
✨면책 (Disclaimer)
이 스크립트는 교육용 도구(Educational purpose)이며,
투자 조언(Financial advice)이 아닙니다.
모든 트레이딩에는 손실의 위험이 있으며,
DFI의 신호나 수치가 수익을 보장하지 않습니다.
✨정리
DFI는 단순한 “추세 오실레이터”가 아니라,
에너지의 흐름 + 피로도 + 레짐 정렬이라는 3요소를 결합해
“지속 가능한 방향성”을 시각적으로 표현하는 지표입니다.
즉, 단순한 ‘방향’이 아니라 “추세의 질(Quality)”을 보여주는
새로운 형태의 Flow 분석 도구입니다.
